Author: Ben Tewey
Date: 3/20/22
Share Price: $243
Ideal Entry: below $220
Introduction
American Tower is the largest global operator of wireless cell towers and other communication real estate. The company primarily earns monthly recurring revenues through rent by leasing space on its tower sites to wireless carriers (T-Mobile, Verizon and AT&T in the United States).
As shown below, typically, the tower company will own or lease under a long term contract the tower structure and ground interest with tower being built to support 4-5 tenants while the tenant will own and operate the equipment (antenna arrays, antennas, coaxial cable) and the equipment shelters.
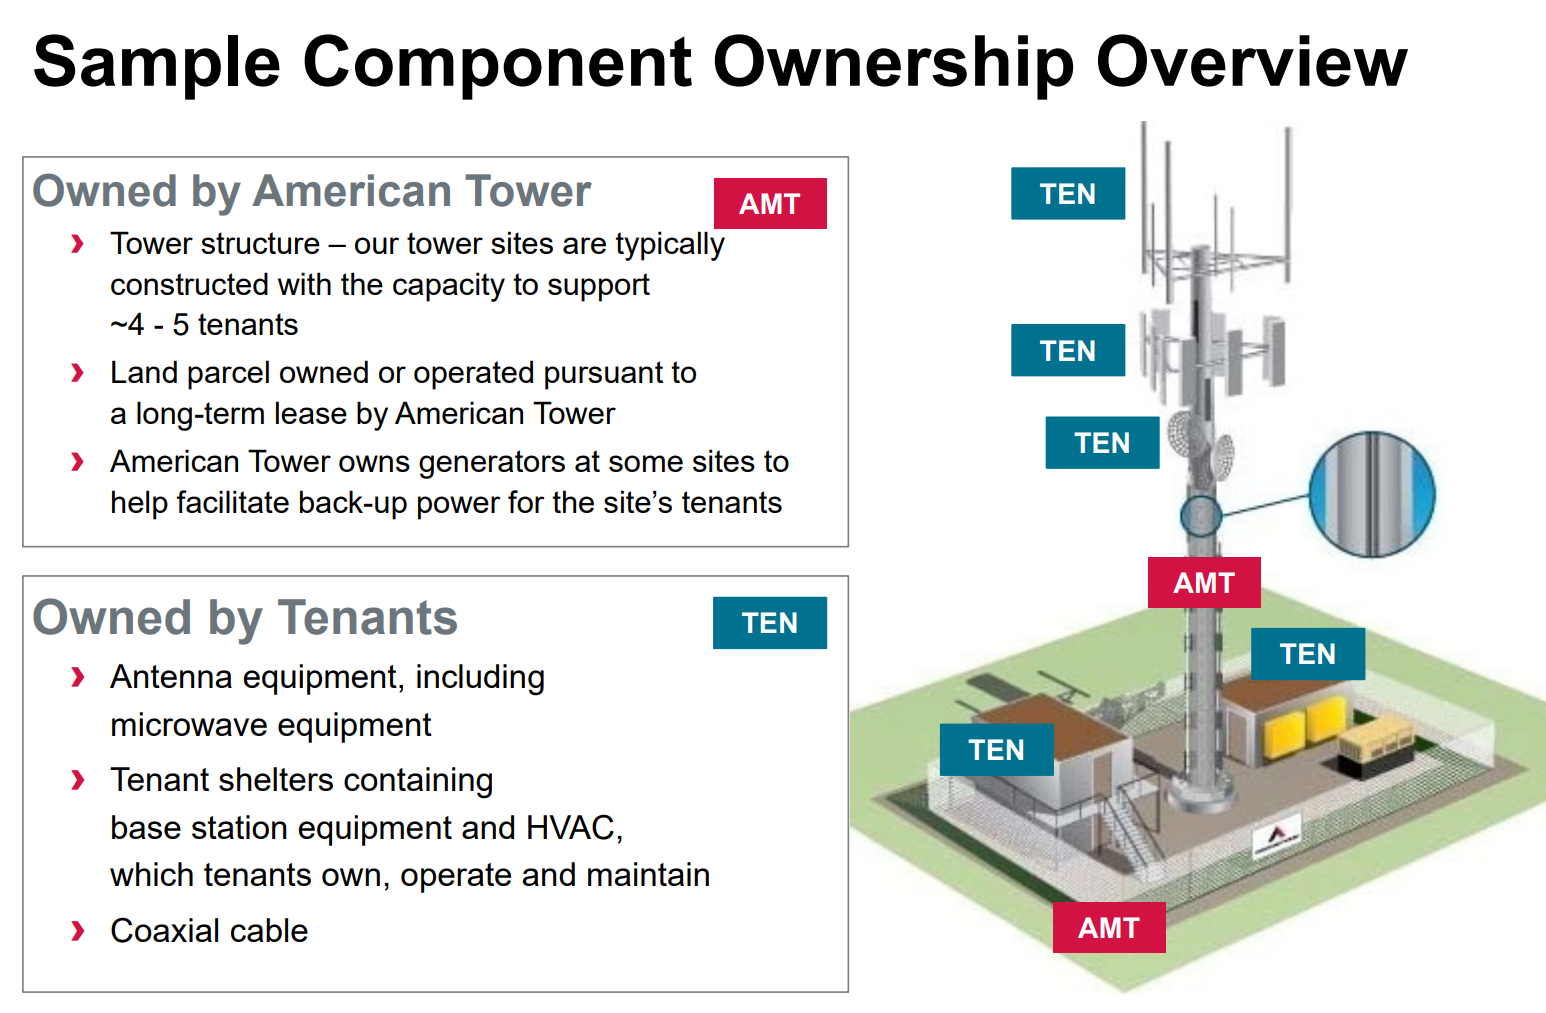
The result is a long term, recurring revenue stream with built in escalators of 3% in the US and CPI based in international markets. These contracts are typically 5-10 years in length with multiple renewals and, notably, are non-cancellable. For context, rent charges are typically based on property location, leased vertical square footage and the weight of equipment on the tower.
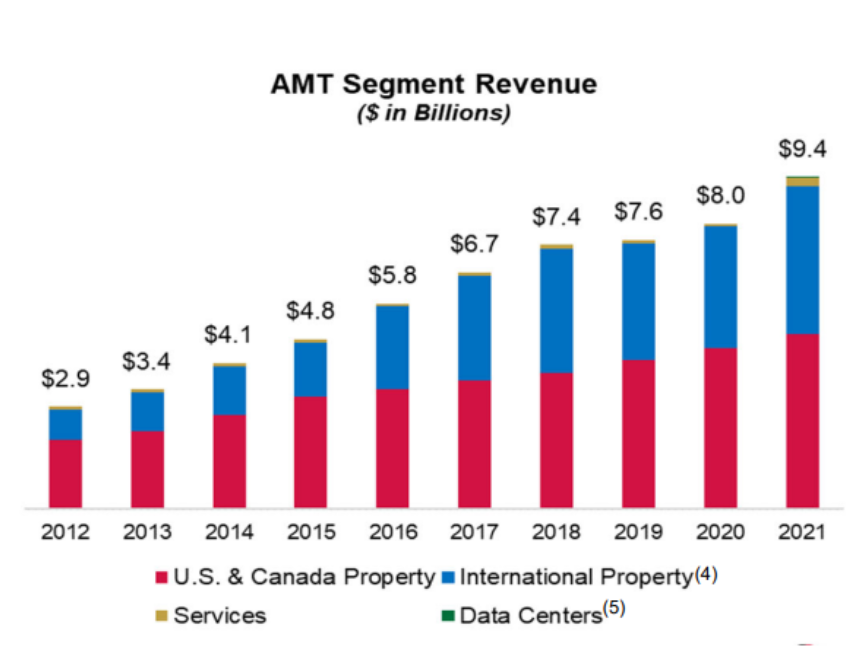
The company experiences low average net churn in the range of 1%-2% annually (though it’s been higher in recent years due to India carrier consolidation and the Sprint Merger), which makes the business very predictable.The company operates over 220,000 sites in North America, Latin America, Europe, Africa and APAC and did over $9.3bn in revenue in 2021 with operating margins north of 32%.

Business Overview
The revenue model for American Tower is extremely simple. The three main variables to understanding revenue are:
- How many towers does AMT have?
- What is the average tenancy?
- How much does each tenant pay?
Tenancy is an important metric for tower operators because the business is a high fixed cost, low variable cost model. Meaning as new tenants are added to a site nearly all of the incremental revenue generated drops to the bottom line. Towers require very little maintenance capex (~$500-$800 annually in international markets and $1,200-1,700 in the U.S.) and the tenants (mobile carriers such as AT&T, Verizon, TMUS in the U.S) put up most of the capital by providing their own equipment.
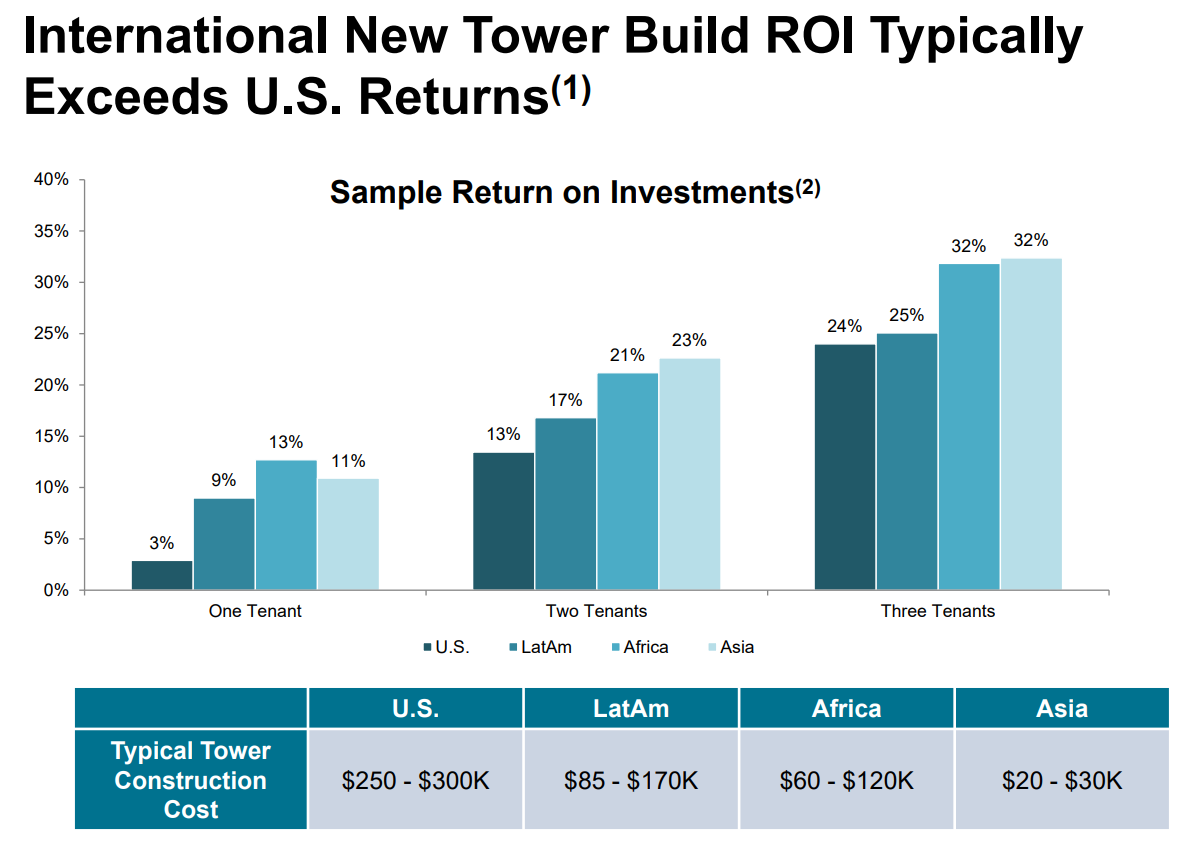
The unit economics on a tower are incredible due to the inherent operating leverage. In the table below it is clear that additional tenants result in minimal incremental operating costs. Generally, it costs ~$275,000 to build a tower. Revenue for a one tenant tower is ~$20,000 with $12,000 in operating expenses leaving the company with a 40% gross margin or $8,000 or an ROI of 3% ($8,000/$275,000). However, adding an additional tenant requires very little additional operating expenses and co-locating tenants typically pay higher rents than anchor tenants; the 2nd or 3rd carrier on a tower results in very high margin dollars falling to the bottom line. In all this leads to the typical 3 tenant tower having an 83% gross margin as AMT will generate $80,000 in tenant revenue while only paying $14,000 in operating costs. Leading to ROI on a tower build of 24% ($66,000 gross income/$275,000 build).


Naturally, the question of why a carrier would outsource such a phenomenal business arises. It is more profitable for a third party such as American Tower to build or buy communications sites and lease them out to carriers than the carriers owning the towers themselves due to competition and average tenancy. A carrier that owns its own tower assets will likely have a much lower average tenancy than an independent tower company would due to economic incentives. AT&T would be hesitant to rent their best tower assets to Verizon leading to lower average tenancy and therefore poor economics. As a result, towers owned by carriers have an average tenancy only slightly above 1 while towers owned by AMT or other third parties have an average tenancy in the range of 2.5-3.
The returns internationally are even better than that of the U.S. because construction costs are significantly less at $85k-$170k in LaAm, $60k-$120k in Africa and $20k-$30k in APAC and as mentioned before maintenance cap-ex is only $500-$800 annually. As you can see from the chart below, the returns do not suffer from this lower cost to build. The higher returns are met with high risks in these international markets however.
- Higher customer risk in the form of consolidation as we saw from 2016-2019
- Regulatory risk
- Foreign currency translation risk.
American Tower is also able to pass through more of its operating costs of the ground and maintenance in international markets and escalations typically based on local inflation rates as opposed to a fixed 3%.
Segment Revenue
American Tower operates in seven reportable segments:
- U.S. and Canada
- Asia-Pacific
- Africa
- Europe Latin America
- Data Centers
- Services
U.S. and Canada
The U.S. and Canada segment is by far the largest segment doing just under $5bn in revenue in 2021. The company operates more than 43,000 properties in this segment alone. In a year without significant acquisitions, tower count increases in the range of 150-250 new towers per year through minor roll ups and new site builds. However, the primary growth in tower count comes from large acquisitions as we see in 2015 with the acquisition of over 11,000 sites from Verizon.
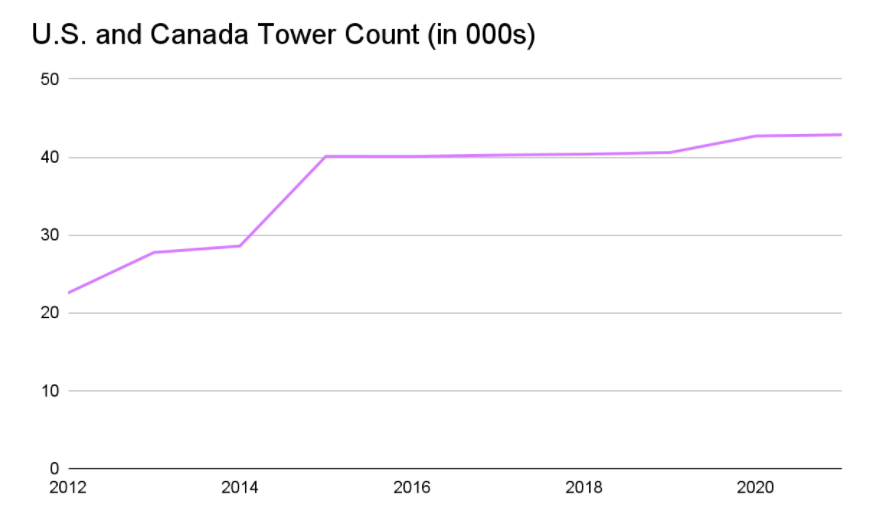
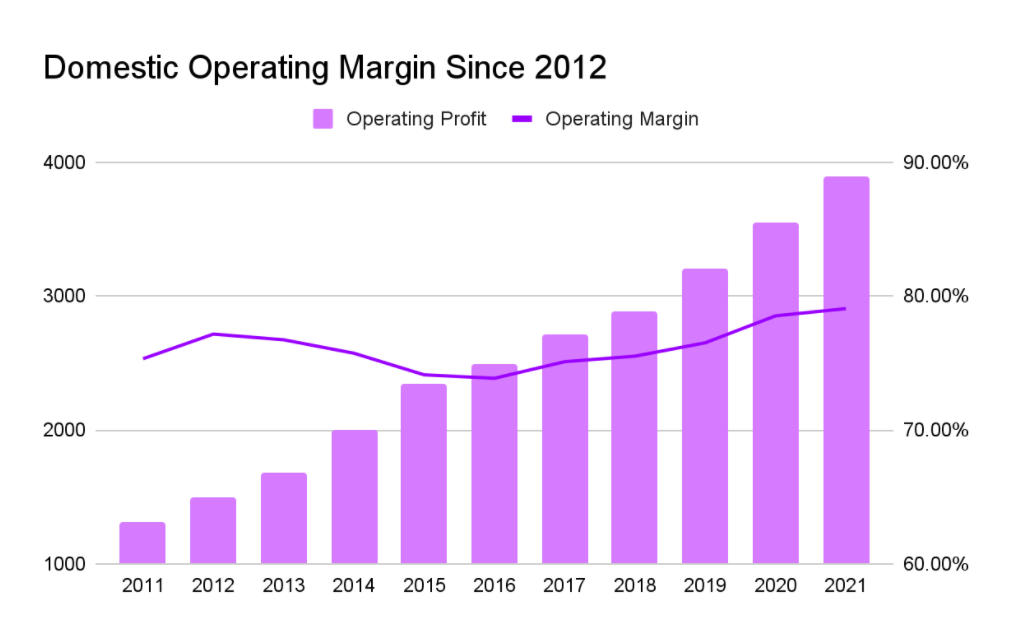
Since 2012 AMT has grown domestic revenues 9.8% per year and domestic operating margin has expanded from 75% in 2011 to 79% in 2021. The dip and recovery we see in 2015 is as a result of acquiring the lower average tenancy towers from Verizon. After acquisition, average tenancy tends to rise.
America Tower does not disclose tenants per tower or avg revenue per tenant, but there are a few indirect methods to back into the numbers. Crown Castle, the second largest U.S. player by towers, operates about ~40,000 towers. In 2021 the company tower segment did $3.8Bn in revenue and siclosed that they had average tenancy of 2.3. Using these numbers we can back into ~$41,000 in revenue per tenant. We can also do similar math for SBA Communications, the third largest players, who operated 17,300 towers and disclosed an average total tenancy of 1.8. We bump average tenancy up for the domestic segment as these towers usually have more tenants than the international players. Taking the company’s $1.68bn of domestic revenue in 2021 divided by the 17.1k domestic towers they operate divided by our estimated domestic average tenancy of 2.2 we back into ~$44,000 in revenue per tenant.
We estimate that American Tower’s average revenue per tenant is ~$42,000 based on the $4.92bn in revenue in domestic revenue per tower divided by the 43,000 average towers they operated in 2021 divided by our estimate of average tenancy of 2.7. We feel confident in our estimates as it jives with the gross margins that AMT disclosed in their supplemental materials for Q4 below.
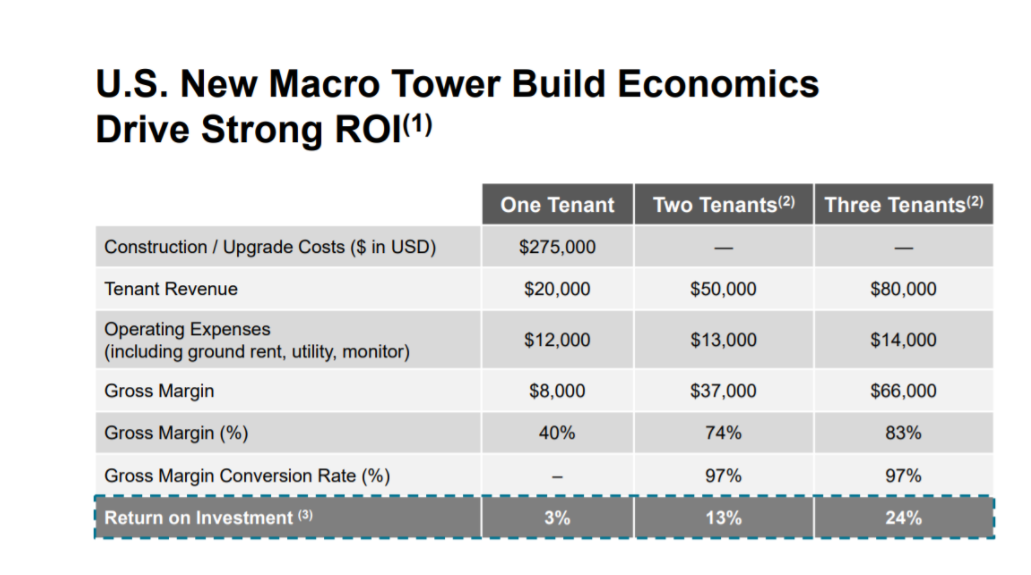
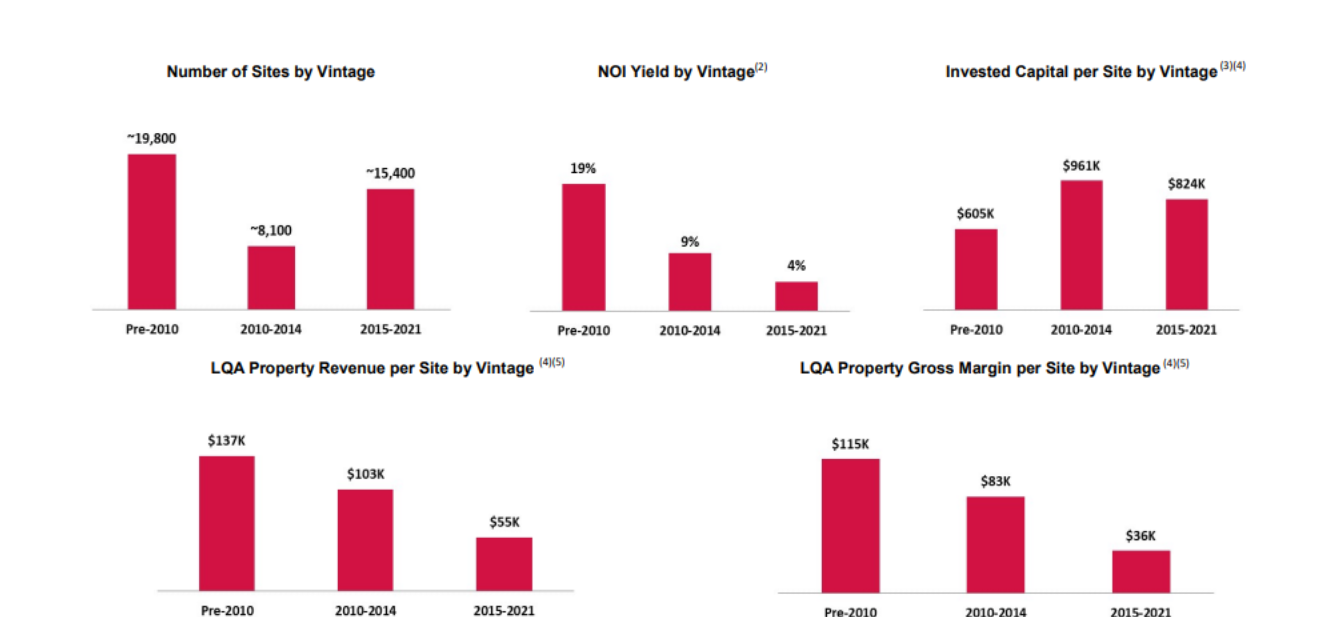
From AMT’s hypothetical tower unit economics shown in the chart titled “U.S. New Macro Tower Build Economics Drive Strong ROI” above we can sense check our math. Using our $42k number, we back into ~3.2 tenants per tower for Pre-2010 towers and an 84% gross margin. This is in line with expectation from the chart with the 3 tenant tower having an 83% gross margin. For the 2010-2014 vintage, we estimate average tenancy of 2.4 and a gross margin of 80% which is just about halfway through the two and three tenant gross margin disclosed in the chart. Finally for the newest vintage towers, (2015-2021) we back into ~1.3 tenants per tower and a gross margin of 65%, again between the 1 and two tenant scenarios disclosed.
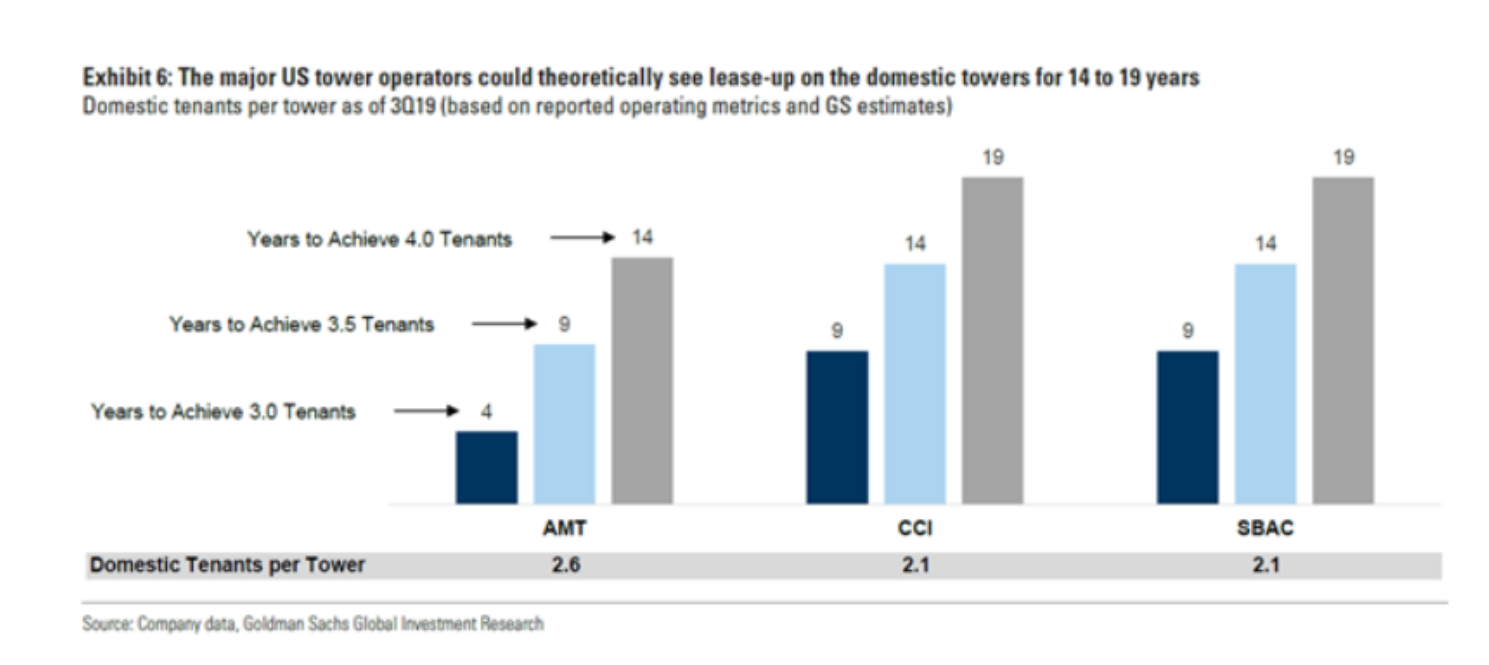
Goldman predicts that AMT will hit the three tenants per tower mark by 3Q23, again in line with our
estimates.
Our estimate of $42,000 in average revenue per tenant per tower is an enormous help in backing into the yearly growth the segment will experience. To estimate revenue for a given year or parse our underlying estimates in management guidance once we have these numbers is just some simple math. For example To estimate next year’s domestic revenue we take our estimate of average towers*average revenue per tenant*1.03 for the built in contract escalators*average tenants per tower. Inherent in this estimate is that churn and amendment/colocation revenue offsets over time which has been the case over the last decade or so.
Whew. Okay, let’s back off the math for a second. The domestic tower segment is an incredible business as we described earlier and sports nearly 80% operating margins on 82% gross margins. Organic tenant billings growth, basically same store sales grows about ~3% every year due to the price escalators with some variance due to churn and amendment revenues (upgrades). Management has recently stated they expect this number to increase to 4% per year through 2027.
There is significant custom concentration in the AT&T, T-Mobile; and Verizon accounted for an aggregate of 88% of the U.S. & Canada property segment revenue in 2021. Dish recently signed a new contract with AMT which will increase average tenancy in the U.S. The more fragmented the carrier industry, the better for AMT as it leads to higher tenancy and margins.
Before closing out this segment review, I wanted to touch on just the terrific margins and economics these towers have. Towers take about a decade to mature to 3 tenants and earn in excess of 20% net margins at maturity and require less than 1% maintenance cap ex to revenue per year. All of this is to say that as the portfolio matures AMT should experience long term margin expansion.
International Segment
As the U.S. tower market has matured (site count has been flat since 2015), AMT has turned it’s attention to international expansion. In 2005, 84% of AMT’s towers were in the U.S, now the figure has reversed . Officially, AMT has 4 reportable segments that account for each geography: Latin America, Europe, APAC and Africa. In order to avoid redundancy I am going to write these up as one segment and touch on some important individual points.


Internationally, AMT has over 176.8k towers accounting for just over 80% of the mix. However, the segment contributed only 44% of revenue in 2021 and had 58% gross margins implying significantly lower average tenancy hovering in the 1.5 range or lower. These numbers are artificially low due to recent acquisitions.
Much of the recent growth in the segment has come through significant acquisition. In 2021, AMT acquired Telxius from Telefonica for over $9.4bn adding over 7,000 towers in LatAm and over 24,000 towers in Europe. As we mentioned earlier, average tenancy should significantly increase as a result of the towers moving to a neutral third party and we should see significant margin expansion over the long term as average tenancy increases. (Short term we will see some contraction due to the lower tenancy towers being integrated and overpowering the smaller base of older, more tenanted towers. Management has guided to 53% gross margins for the first full year of integration, but that should rise over time to what we see historically, 75% as modeled by 2020). Organic tenant billings growth (a similar metric to same store sales) has historically grown at 7% annually since 2015 as carriers upgrade equipment and price escalators are tied to local inflation
The international tower business has even better economics than the domestic business. New builds are significantly cheaper than that of the U.S. at $85k-$170k in LatAm, $60k-$120k in Africa and $20k-$30k in APAC. Maintenance cap-ex is generally only $500-800 annually.
To quickly touch on each segments primary customers:
- Asia-Pacific: Vodafone Idea Limited; Bharti Airtel Limited (“Airtel”); and Reliance Jio accounted for an aggregate of 89% of Asia-Pacific property segment revenue.
- Africa: Airtel; and MTN Group Limited (“MTN”) accounted for an aggregate of 73% of Africa property segment revenue.
- Europe: Telefónica S.A. (“Telefónica”); and Bouygues accounted for an aggregate of 74% of Europe property segment revenue.
- Latin America: AT&T; Telefónica; and América Móvil accounted for an aggregate of 60% of Latin America property segment revenue.

This graph shows the sheer size of AMT commitment to international business. Since 2011 the company has grown their international tower count 9 fold. International has the same competitive moat as the US with high switching cost and capital intensity to build major scale. While some of the markets in Western Europe such as France, Germany and Spain are mature markets like the U.S. much of the international exposure is to technologically burgeoning countries such as India (42% of international tower count), Brazil (13%) and Africa (12%).
The Asia portfolio earns NOI yields, defined as gross margin per site divided invested capital per site, above 10%. Well over 80% of these towers are young with vintages from 2015-2021 and should see their economics improve as they mature. This segment earned 1.1bn in 2021 and had the worst margins of the international group.
The Africa Portfolio earned above $1bn in revenue for the first time in 2021. NOI yields were 11-14%. Organic tenants billings growth has been stellar in the HSD for the last 3 years gross margins have hovered around 65-66%. Churn has been consistently below 1%.
Europe tower count more than 6x’d as a result of the Telxius acquisition from 5 thousands sites to north of 30k. This caused gross margins to plummet from 81% in 2020 to 61% in 2021. We should see margins recapture their former glory as the average tenancy rises on the Telxius towers.
The NOI yields on the Latin America portfolio are a thing of beauty. AMT is earnings NOI yields of 34% on 4,400 towers acquired before 2009. The yield are the towers post 2010 are less exciting sporting only 8-9% yield. Revenue per site by vintage and gross margin per site by vintage are cut nearly in half when moving from the 2009 to post 2010 cohorts. Churn hovers around 1.5% of revenue per year but this is more than compensated for by amendment and escalion revenue advancing at above 3% each per year. Gross margins are ~69% and operating margins are ~61%.
In all the international segment has the wind at its back as the shift to wireless communication continues and mobile traffic and devices grow exponentially increasing demand for denser networks. Towers in these countries have phenomenal economics and will benefit from price escalations and higher average tenancy as they grow.
Data Center Segment
AMT recently acquired CoreSite, a data REIT, for $10.1bn or $170 per share. This segment is relatively small compared to the AMT tower business as a whole. CoreSite did $650mn in revenue in 2021 and sports about 50% EBITDA margins, 22% operating margins and has its largest presence in San Francisco, LA and Northern Virginia. The business grew MSD over 2020 and should open up new verticals for AMT, although the company has stated they are first and foremost a tower company.
Last note, management has stated they plan to finance the acquisition with half equity (~$5bn) and increase of 4.5% of shares outstanding to about 475mn shares out.
Industry Dynamics
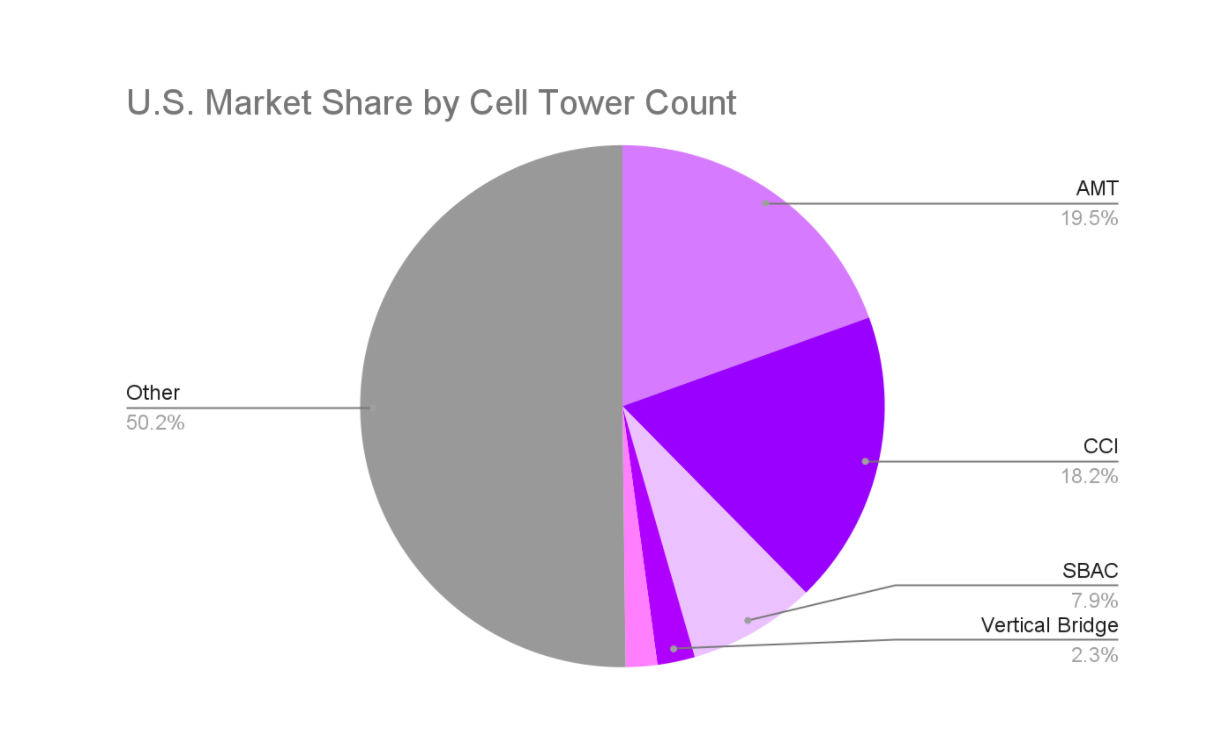
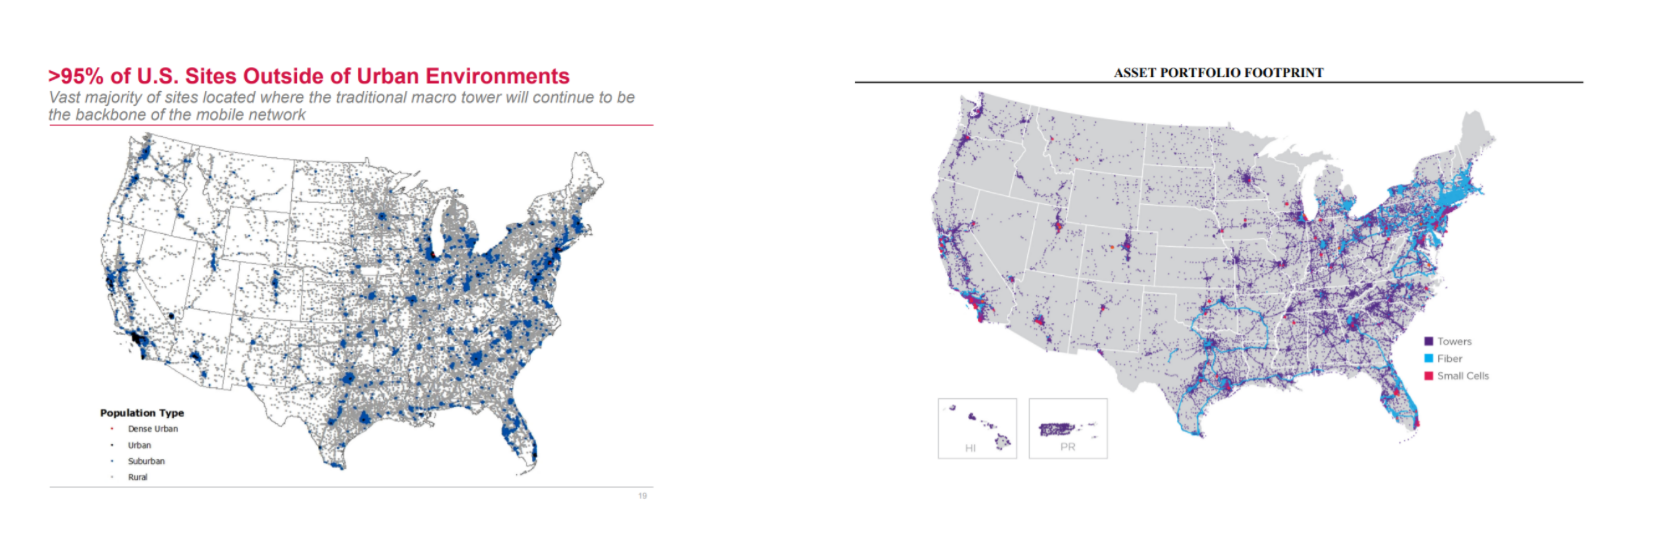
Understanding the tower industry as a whole is critical to understanding why we prefer AMT. The three largest players in the domestic industry by tower count and revenue are: AMT, Crown Castle International and SBA Communications. In the U.S. these companies look nearly identical. Although I have not included SBAC’s map below there is little difference between AMT on the left and CCI on the right. At the turn of the millennia these companies were incredibly similar as the U.S. footprint made up nearly all of their revenues. As Elliot put it in their Reclaiming the Crown activist presentation on CCI. “In 2005, the big three were largely the same (SBAC, AMT, and CCI all derived a significant portion >85% of rev from US towers) as the market matured [Total towers in the US has stagnated since ‘15] SBAC and AMT looked to stay pure-play tower and went international and CCI went into fiber.”
SBAC and AMT attacked the international business acknowledging its superior economics to small cells. SBAC currently owns and operates towers in 15 international markets throughout South America, Central America, Canada, South Africa and the Philippines with their largest international market being Brazil. As of December 31, 2021, they owned 16,821 sites in international markets, of which approximately 30% of total towers were located in Brazil. SBAC is a significantly smaller player with only 1/10th of the towers of AMT internationally and therefore has lower margins, they differ in capital allocation as SBAC has elected to repurchase modest amounts of shares compared to AMT who has issued equity to grow. Churn is about the same at >1%. Domestically, SBAC and AMT both target rural and suburban areas where macro (cell towers) are the most effective technology.
CCI chose to go a different route. Crown Castle has similar scale to AMT in the U.S. with over 40,000 towers and average tenancy of 2.3, but has no international exposure. Instead, CCI focuses on urban markets in the U.S. and has allocated cash to small cells. Small cells are wireless antennas on lower architecture like rooftops of small buildings and signs/lamp posts. Macro cells are wireless antennas on towers and rooftops of large buildings. American Tower thinks that the bulk of U.S. based 5G wireless will be delivered on macro cell towers because 85% of the population lives in an area less than 5,000 people per square mile, and it’s the most cost effective way for carriers to provide wide area 5G coverage to their customers. The likely answer is a mix of both as small cells are likely to be more effective in dense urban areas.
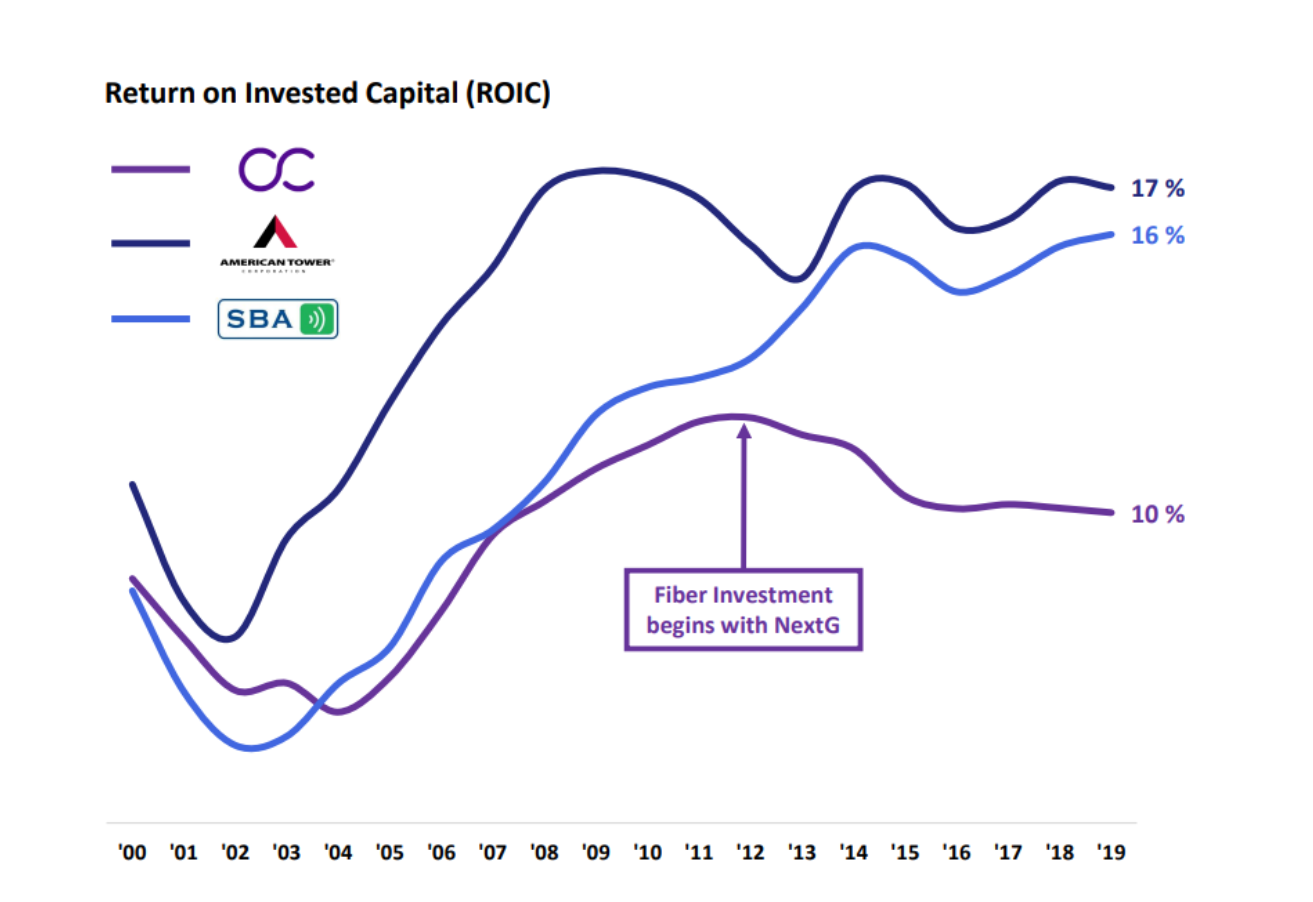
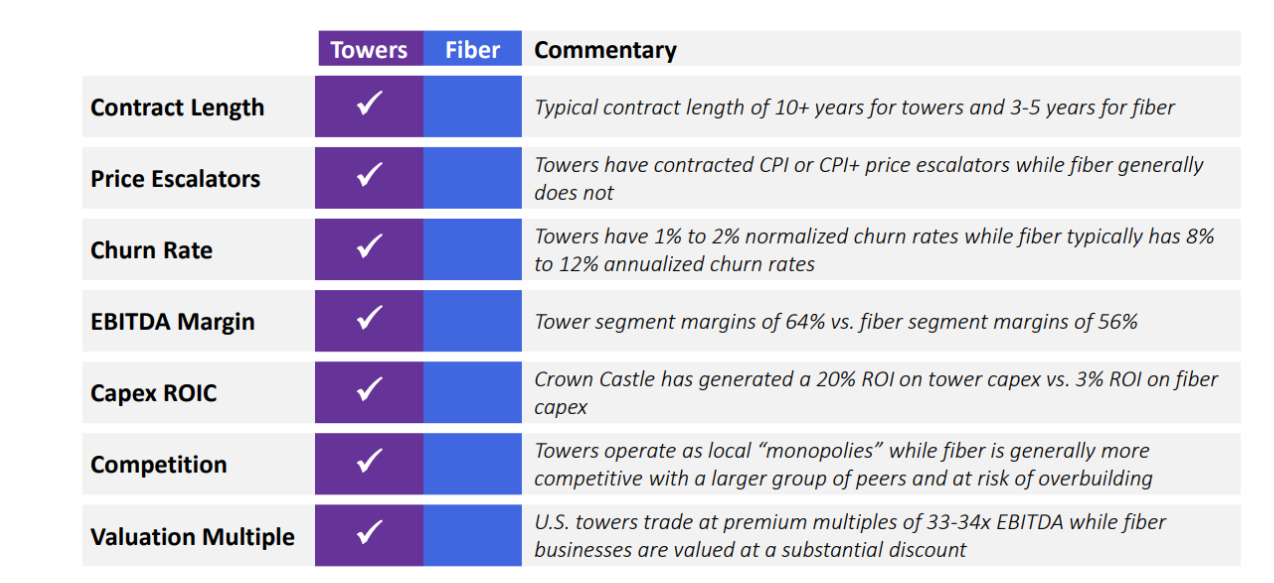
In our view the small cell strategy is inferior to the tower business. Fiber is much more capital intensive (30% of CCI revenue, 27% of EBITDA and 70% of capex). Leading to significantly lower returns on invested capital. Towers are one of the greatest businesses ever: longer contract lengths, higher price escalators, lower churn rates, higher EBITDA margins, higher cap ex-roic and lower competition. Towers run themselves so management adds value by keeping costs low and allocating capital intelligently as towers are highly cash generative. CCI spends 3x the amount annually on fiber cap ex than they do on tower cap ex and according to Elliot Capital Management, “Fiber has never generated positive cash flow [for CCI].”
International Players
Infrastructure Wireless Italiane- Inw.mi
Cellnex Telecom- Cllny
IHS Holdings Limited- IHS
Helios Tower-HTWS.L
Barriers to Entry and Moat
The tower industry benefits from scale economies and switching costs. Scale helps in spreading certain fixed costs such as spending on IT and maintenance across more tower sites and negotiating contracts with carriers (the more coverage a carrier can get with one contract, the more power in the negotiations).
The company also benefits from the switching costs of its customers. Carriers are reluctant to switch tower companies unless they absolutely have to because removing equipment from a tower and moving it to another’s is on the carrier and includes significant risk of outages and downtime. Crown Castle has stated that it costs $40,000 to remove equipment from a tower. With annual rents ranging $20k-$30k, it’s easy to see why switching would be cost prohibitive.
Demand Drivers
The wireless communication industry has significant tailwinds at its back ensuring consistent, durable growth throughout the next decade. Secularly growing demand for wireless communication (which we can measure through mobile data usage and wireless device growth) and the increasing demand for high-bandwidth applications and higher quality of service result in a narrower range at which signals can be transmitted. As a result, carriers are investing in denser networks.
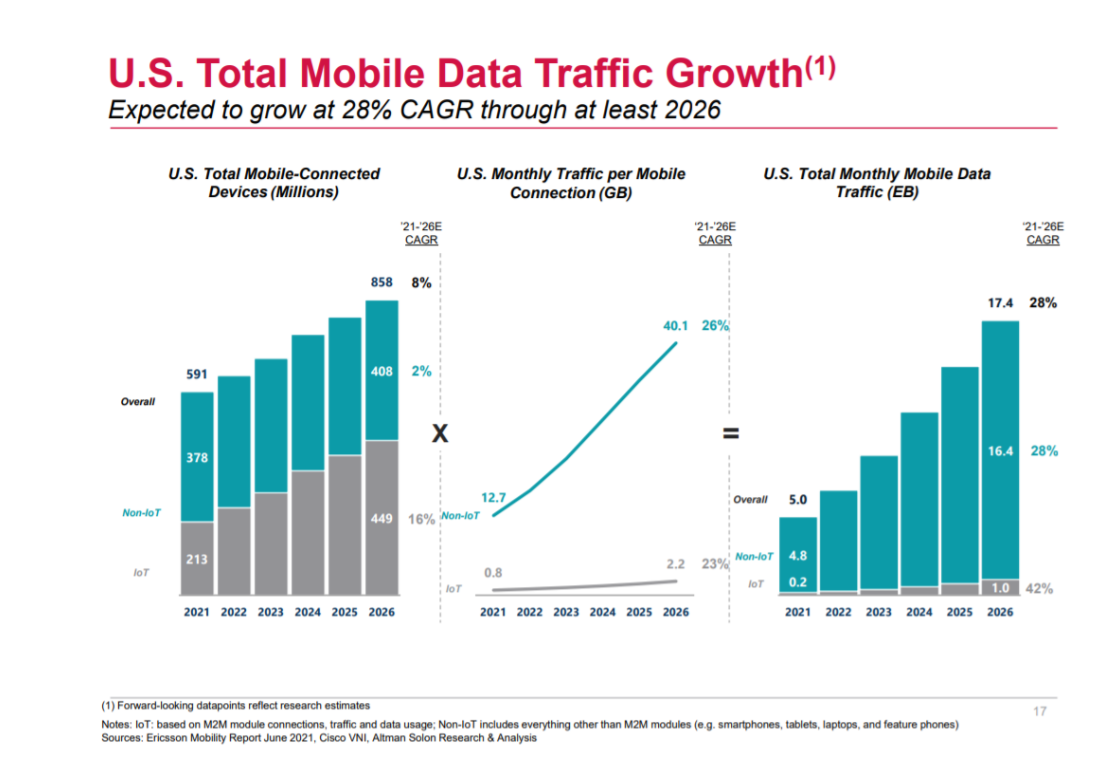
Mobile data usage is expected to grow exponentially, which will lead to eventual upgrades of the wireless equipment on tower sites. These upgrades typically mean heavier and bulkier equipment, which leads to amendment revenues for the tower companies (remember a portion of the rent is calculated by weight of equipment on the tower). The industry saw significant growth in amendment revenue in 2018 and 2019 as the carriers fully converted to 4G. The cycle is now restarting again with 5G.
Furthermore, the cost of cell phones decreasing (Apple and Android selling cheaper options and a robust secondary market) is a tailwind for AMT as it enables more people to get online through mobile devices increasing demand for data and pushing the carriers to densify their networks leading to more tower builds.
To put more numbers around the demand drivers: total mobile connected devices is expected to CAGR at 8% through 2026, average data use per device is expected to grow at 26% per year through 2026 and mobile data traffic is expected to grow at 28%.
Capital Allocation and Reinvestment Runway
Management has been clear about the capital allocation. In order to maintain their status as a REIT, AMT must pay out 90% of their taxable income as dividends each year. After that the company will make investments in both revenue maintaining cap-ex and revenue generating cap-ex. Revenue generating cap-ex includes:
- Capital spending to increase capacity of towers (e.g., height extension, foundation strengthening, etc.)
- Purchase land
- Capital spending for construction of new communications sites and generators
After that, AMT will attempt to stay within their target leverage range of 3-5x (they are currently above this so expect to see additional capital allocated here). As towers are incredibly cash generative assets the company has consistently been able to engage in roll-up M&A.
As seen below, discretionary cap-ex spend constitutes the majority of cap-ex over the last decade. Corporate costs have been held relatively flat and revenue maintaining cap-ex has risen modestly in relation to the new sites acquired or built over the same time when taking into account that in 2011 AMT owned and operated ~54,000 communication sites compared to ~220,000 now.
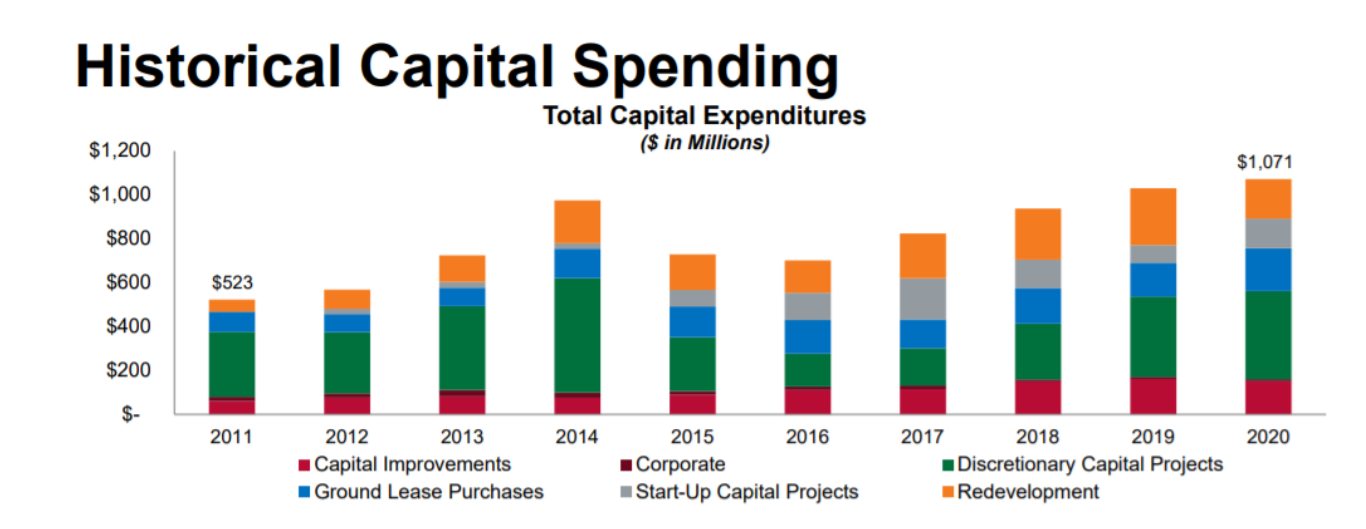
The company has done well to take advantage of towers’ cash generative economics, keeping cost lean and earning high returns on capital.
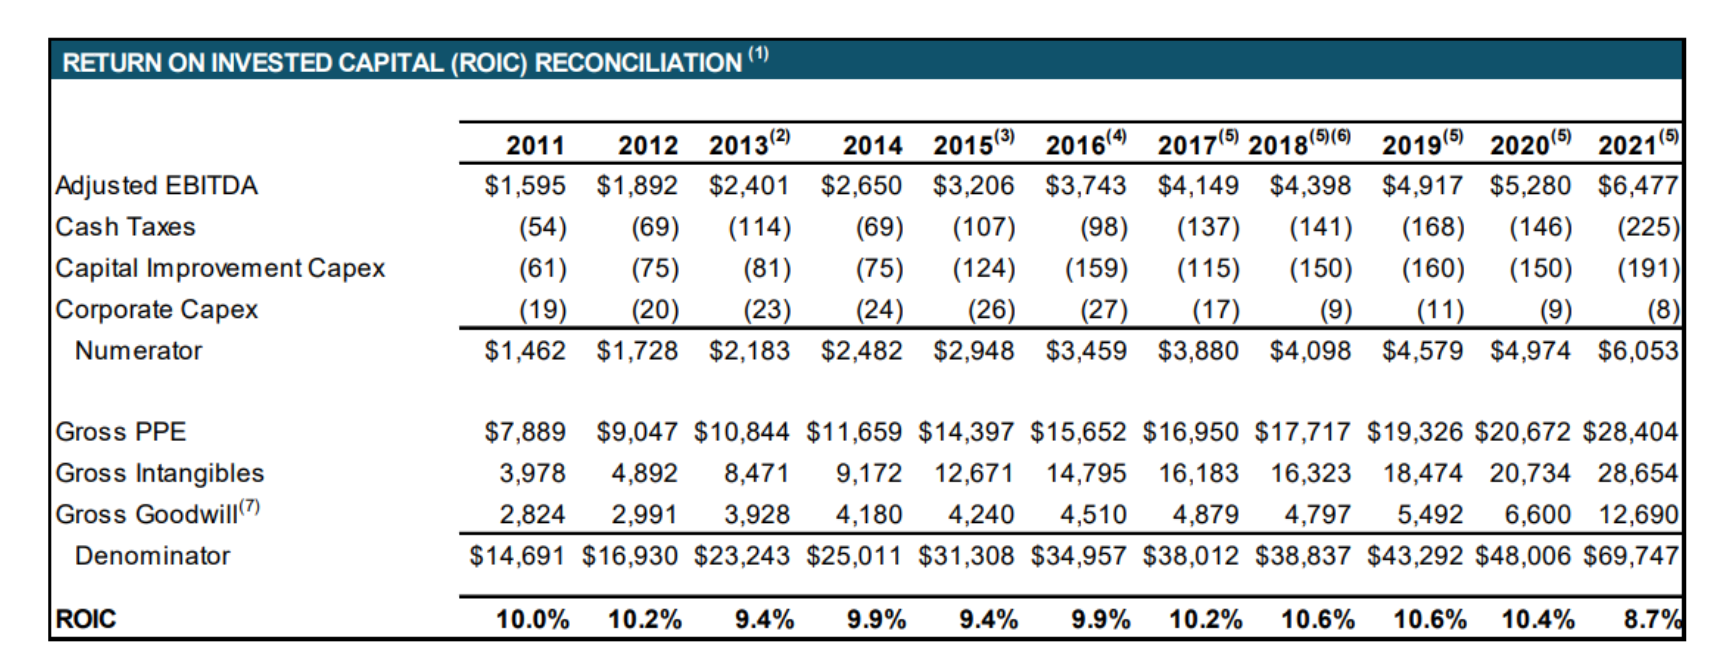
Management has consistently allocated capital intelligently with ROIC in the range of 10% and WACC in the 6% range.
Financials and Valuation
In my mind there are three different companies in the market. Regular equities where you go about valuation as normal. These account for the vast majority of listed equities. Use a DCF and multiple relative to itself to triangulate a fair value. Second: banks, where a lot of the valuation comes from the right side of the balance sheet. Finally, REITs where much of the ideas are the same as regular equities, however the jargon is slightly different where you have to deal with NAV and FFO instead of book value and free cash flow. DCFs have their flaws in the space as they ignore the debt structure that REITs use, but the general premise of summing up future cash flows (FFO or AFFO) and discounting them back is the right mental model.
For historical context AMT has CAGR’d property revenue at 14.3% per year since 2011, AFFO per share has grown at 13.8% per year and property operating profit has grown at 12.5% per year.
Management has laid out guidance through 2027 for AFFO per share to grow in excess of 10% per year. With the addition of $700mn in revenue from the newly acquired data centers and ~$24,000 in revenue per site on the 25,000 sites acquired last year from Telxius adding $400mn in incremental revenue in 2022 we should see AMT top $10bn in revenue for the first time. Gross margins will be depressed due to the newly acquired towers lower average tenancy but should remain above 61% in 2022.
AMT has been in a land grab for tower assets since 2011 growing total tower assets at a clip north of 13% per year. We believe that while there is still opportunity for roll-ups, the next 10 years will look different than the last 10.
Our models are designed as a starting point for thinking about the business and to lay out a base case. There is definitely room for improvement in the model as I think margins will look different in the future and revenue per tower could exceed our expectations, but this is a start.
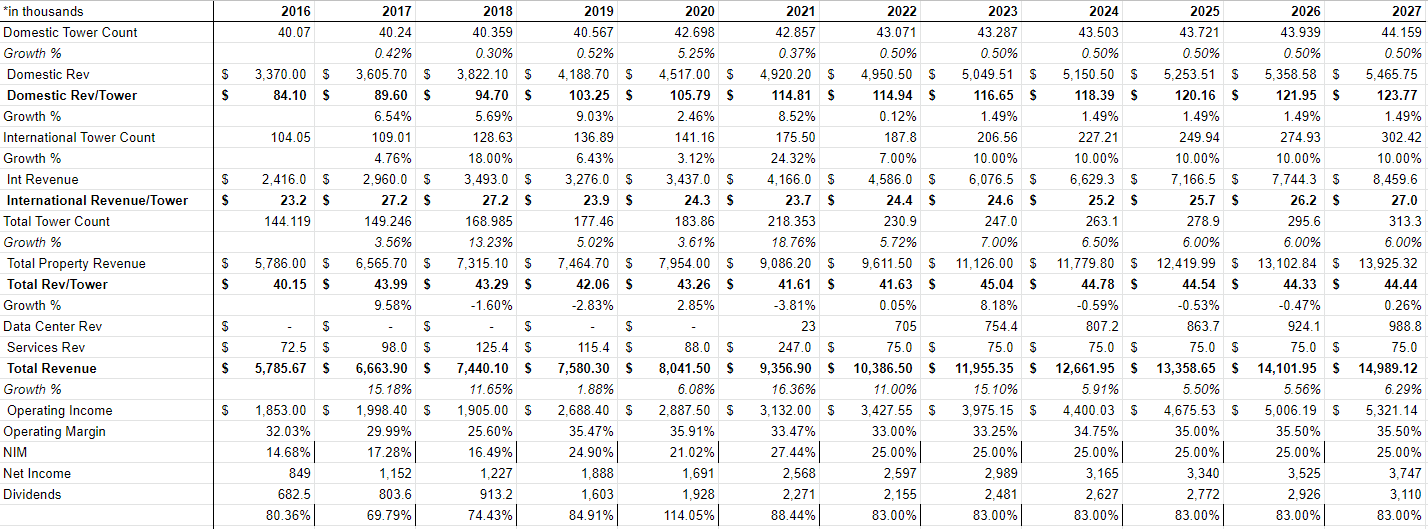
We model modest domestic tower growth incremental revenues from higher average tenancy and 3% escalations per year. International revenue per tower estimates are likely to be too conservative as the Telxius towers experience rapidly increased average tenancy.
We model dilute shares out increasing at 1.5% per year after the big issuance of 20mn this year. We assume increasing operating margins as a result of higher average tenancy (especially with the new acquisitions)
As a short heuristic to get a ballpark estimate for AMT we use a 25x AFFO multiple on our estimate of $8.3bn of AFFO in 2027 for an IRR of 11% from today’s $240 level. This is an AFFO CAGR of 11.5% and a basically flat multiple.
We model churn to be 4% in 2022 (Sprint). We hold escalations revenue at 2.2% (The recent CPI prints could have this assumption prove conservative, but we’re value investors here) and amendments and collocations are held at 3% of revenue. We also model organic tenant billings growth to be in the 4% range and total tenant buildings to be ~8% (with 0.3% dispersion).
Below we attach our reverse DCF for what you have to believe to generate a 10% return. Again this is a jumping off point to hone estimates further (we certainly will and will update you when we do).

Risks
Carrier consolidation is a major threat to AMT’s business. As carriers merge or get acquired, average tenancy on towers falls negatively impacting the economics on the towers. This occurred in India from 2017-2019 as we saw significantly elevated churn ($157mn in churn related costs in 2018 as opposed to $9mn in 2016).
As a result of the Sprint-T-Mobile merger in 2018 churn in the U.S. and Canada segment will remain elevated for the immediate future, but should abate as DISH is onboarded. AMT shareholders should sing hallelujah at carrier fragmentation.
A few other risks to consider is the rather levered balance sheet as a result of the recent acquisitions. Current leverage is in excess of 7-1. Management has stated they intend to keep an investment grade balance sheet.
There are three main ways to get capital. Earn and retain, raise debt or issue more equity. REITs have to pay out 90% of their taxable income to qualify for the benefits of the REIT designation so the earn and retain option is a pittance compared to their capital needs. As demonstrated, AMT has strong demand for densifying their network and plenty of places to deploy capital. As a result, AMT has first turned to leveraging their balance sheet, however they have also consistently tapped the equity markets to raise capital and intend to do so again in the first half of 22.
Diluted shares outstanding have increased from 399mn in 2012 to 455mn in 2021 (with an estimated 20mn more shares to be issued in the next 3 months). Something to keep an eye on.
REITs (like Utilities and other long duration/yield based equities) are very sensitive to interest rates. These sectors have benefited this decade from declining interest rates. It goes without saying that it’s important to remember that owning an asset like this is at least a partial bet on the movement of interest rates, more so than other equities.
One final risk: AMT’s top three customers by total revenue were T-Mobile (20%), AT&T (19%) and Verizon Wireless (13%). They have substantial customer concentration in every region in which they operate.
Conclusion
The tower business is a great business. You have strong recurring cash flows, low cap ex, low incremental capital needs, high barriers to entry, economies of scale, capital and time intensive to build meaningful scale, strong international demand, and rapidly increasing wireless data usage, built in contract escalators and ever growing average tenancy.

Bibliography
AMT Q4 ’21 Supplemental Information
Reclaiming the Crown Activist Presentation
- Check out the Introduction to the Tower Industry, Telxius Acquisition Presentation, CoreSite Acquisition Presentation and the Technology Update
Disclaimer
Disclosure
I do not own any shares of $AMT. I am not a financial advisor. These articles are for educational purposes only. Investing of any kind involves risk. Your investments are solely your responsibility and we do not provide personalized investment advice. It is crucial that you conduct your own research. I am merely sharing my opinion with no guarantee of gains or losses on investments. Please consult your financial or tax professional prior to making an investment.