Author: Ben Tewey
Date: 6/6/22
Share price: $370
Ideal Entry: $330
Overview:
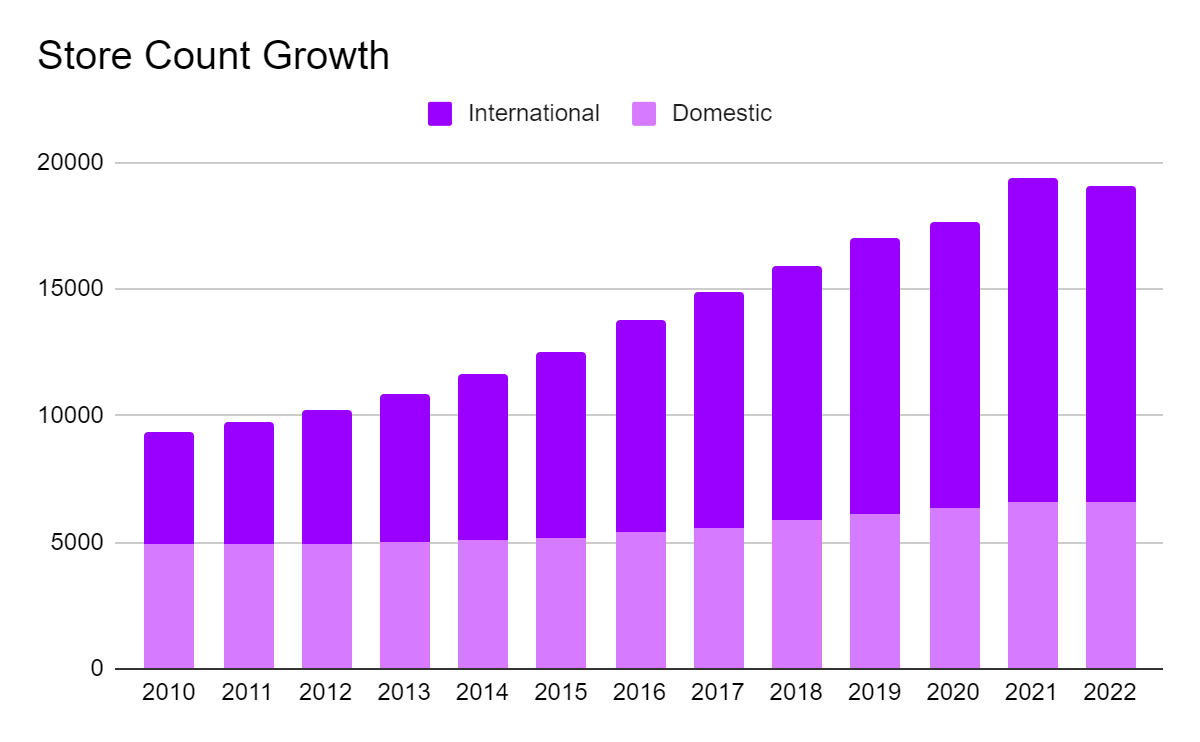
Domino’s was founded at a single store in Ypsilanti, Michigan in 1960. Today, the business sprawls over 90 markets, has over 19,000 stores globally, is valued at over $13 billion and generated $4.3bn in revenue in 2021. Over the last decade, the company has grown revenue at 9.7% per year, bought back 40% of shares, nearly quintupled earnings and has doubled store count for a 6.6% growth per year.
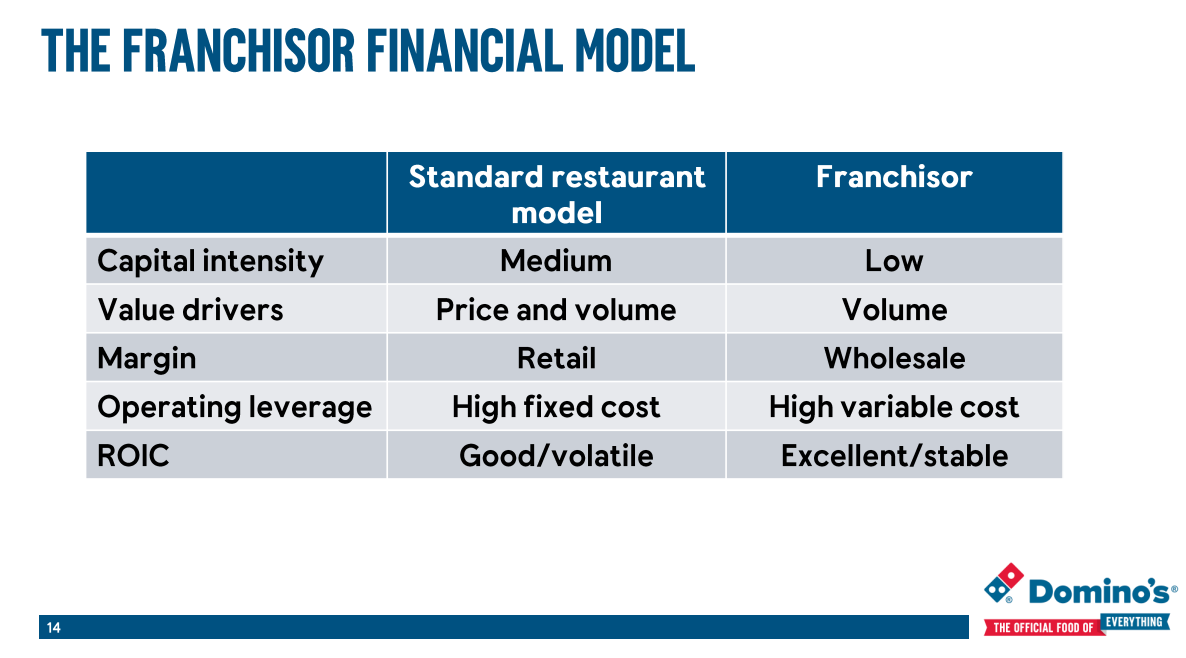
The Domino’s business model is straightforward and easy to grasp: they have made a living collecting high margin royalty fees on restaurants that prepare made-to-order pizzas and deliver them directly to customers’ doorsteps.
They execute this strategy through three business segments: U.S. company-owned stores and royalties ($1.5B or 34.4% of revenue), international royalties ($298M or 6.8% of revenue) and the more capital intensive supply chain which is 58.8% of revenue. The company has steadily expanded net income margins from the mid to high single digits to today’s 11.7%. In the U.S. SSS have averaged over 4% since 2000 and international SSS has been over 5.5% for the same period.
Thesis:
Despite the headwinds DPZ faces, namely the threat of third party food delivery commoditizing food delivery and a rising rate environment with high inflation which promises to raise rates which will affect the DPZ capital structure and input and wage costs which will impact margins in the near-term, I believe the business is resilient enough to weather the storm. Domino’s low cost position which produces industry leading unit economics and process power from oven to delivery create an immensely strong brand with customer loyalty.
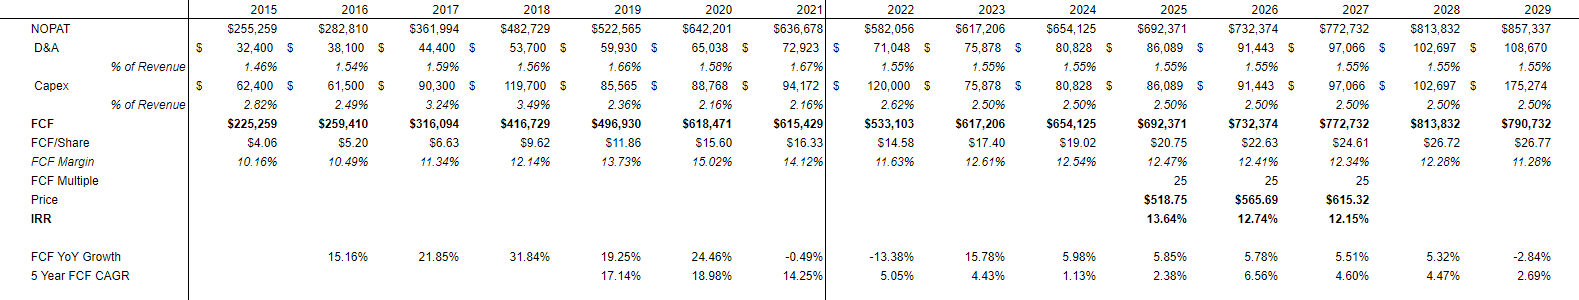
From my base case scenario which is centered around 6% global unit growth through 2025 fueling 6.3% revenue growth per year Domino’s will generate $20.75 in FCF per share. At a 4% FCF yield this results in a 13.64% IRR.
Business Segments:
Domino’s consists of three distinct businesses: The U.S. stores segment, the international franchise royalties and the supply chain operation. In the U.S., which accounts for 23.4% of sales, the company franchises out 94% of its stores and has a total US store count of 6,560. Domino’s generates revenue by charging 6% royalties on franchised store’s top line. In exchange the franchisees get the right to use the Domino’s brand, trademarks, and access the company’s supply chain. These royalties are incredibly high margin (near ~100%) and allow the parent company to be capital-light with phenomenal returns on capital. For context, U.S. sales have grown 9% per year since 2010 and the franchise generates $9 billion in sales from its U.S. stores
Domino’s also collects ~$475mn from the U.S. franchisees to fund national advertising campaigns. The idea here is that by pooling the advertising budget and running national advertising the brand can generate economies of scale by spreading the cost out over larger audiences than what local TV or radio advertising otherwise would be able to.
The company owns and operates 375 stores in the U.S. This gives the company the ability to experiment and test various technologies, operational improvement and menu items. The best practices from these tests can be passed along to the franchisees fostering a culture of innovation and technology adoption. Domino’s also uses these stores as a playground for potential franchisees to dip their toe in the water and get up to speed prior to formally opening their own store.
The company owned store count tends to remain flat over time.The cadence of new build company owned stores and those being sold off to new franchisees cancels out over time. The parent company will pioneer a new region in the U.S. and after a few years of letting the stores mature and training managers to run the franchise they will sell the stores off and go to prove out another region.
Company-owned same store sales have grown about 5% since 2014. The average company owned store generated $1.27 million in revenue in 2021 and had operating in the range of 22-23% or $285k. Therefore, after-tax income in 2021 on a $350k investment was $254k. A 72% return on investment for company owned stores.
Unit Economics
The success of the parent company depends on the health of the franchisees. It’s integral to the operating model that store level unit economics are healthy in order to attract people to open new stores. While it’s true that Domino’s skims their royalty off the top line, they still have to care about the health of the franchisee further down the income statement in order to ensure the stores longevity. 95% of the restaurant owners are former Domino’s store-level employees, meaning they either worked in the store and delivered pizzas or managed the store prior to opening their own. This creates strong brand loyalty as the store is oftentimes the primary source of income for the franchisee.
It costs anywhere from $300k-$350k cumulatively to open up a new Domino’s store. An average store in the US does about $1.4 to $1.5 million in top line (6% royalty generated $540mn in revenue divided by 6,185 stores in 2021). These stores tend to grow SSS at 3-6% in the U.S. with the average since 2000 being 4.1%. Store level EBITDA has grown at an 8.2% CAGR since 2010 to $174,000 in 2021. That means a U.S. franchisee is returning $174,000 in cash flow on a $350k investment, an implied 2 year payback period and 50% pre-tax returns.
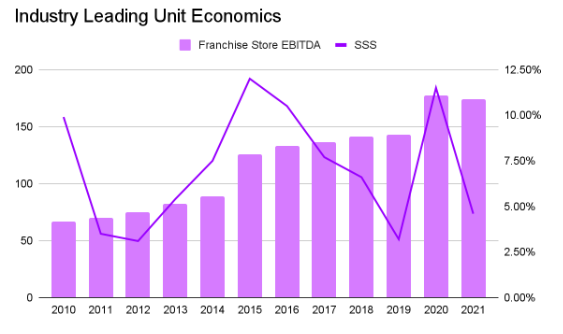
Looking around the fast-casual and QSR restaurant universe, these are best in class unit economics. The average payback period for many franchised restaurants is in the range of 5-7 years, or 14-20% returns. Papa John’s and Pizza Hut’s EBITDA per store is $40k and $50K respectively, despite having larger concepts and intuitively lower payback period. Chipotle, a company known for its unit economics has a similar payback period at 2-2.5x
The average Domino’s franchisee owns 8 stores meaning they control an $11-$12 million dollar business that generates $1.4 million in EBITDA per year. This is a big economic opportunity for franchisees.
Using YUM as an example a franchisee may own a Taco Bell, Pizza Hut and a KFC which are vastly different businesses that require their own expertise. However, because of the profitability of a Domino’s store and the fortressing strategy (having a dense cluster of stores in a single area) franchisees just focus on the Domino’s brand. Allowing franchisees to build their careers around owning these stores alings the parent company and the franchisees to focus on building the brand and growing store count.
Phenomenal unit economics have led to some equally stellar second derivative impacts for Domino’s. Store level EBITDA increasing has put more money in franchisees’ pockets who are eager to reinvest their cash. This has allowed the company to scale store count in the U.S. much faster than its competitors, taking over 6% of market share from Pizza Hut and Papa John’s over the past decade. Both Pizza Hut and Papa Johns have seen stagnant growth as due to lackluster unit economics which do not put franchisees in a similar cash flow position. The easiest way to quantity this is through closure rates. Domino’s closure rate has been below 1%, while its competitors have ranged in the 3%-5% range.
The other tailwind driving unit growth is the low cost to open new stores versus other franchises. A Chiptole or Taco Bell will cost north of $1 million to open. The low start-up costs reduces the hurdle that franchisees have to jump over to open a new store. They can easily open a 2nd or 3rd location with the cash flows generated from their existing stores.
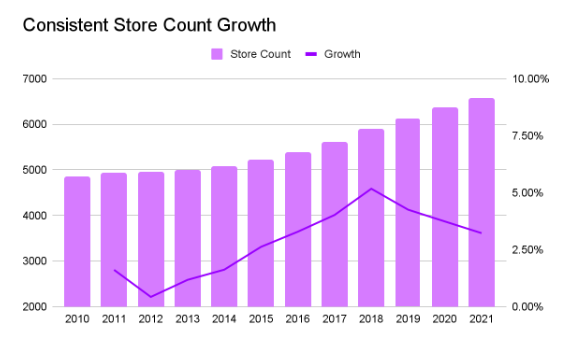
Overall U.S store count has grown 2.5% per year over the last decade and now tops 6,500 stores. Unit development peaked in 2018 when the franchise added 289 stores, but management has stated that there is a pathway to 8,000 stores in the U.S. At the current run rate that would take 7 years to hit.
International
Dominos has 12,288 stores overseas. The international stores are franchised out under master franchise agreements. The international segment contributed $298 million in royalty revenue in 2021 (7%) on north of $9.1 billion in store volume implying a 3% sales royalty.
The royalty on international stores is below that of the domestic base because the parent company and the master franchisor will split the royalty revenue generated from the stores in the region. This additional layer passes the responsibility of opening new stores, marketing the brand and recruiting franchisees to region specific experts who have an understanding of the cultural and consumer idiosyncrasies in exchange for a cut of the royalties and use of the brand. This is why the store royalties to the parent are lower internationally. Additionally, in a way this is an admission of Domino’s management that running the brand in other geographies is outside of their circle of competence, but that they believe the model is prolific enough to be replicated worldwide.
These master franchisors are granted distribution rights for entire regions or countries and some of the largest ones are public companies. Domino’s Pizza Enterprises, the Australian franchisor, is a $6 billion market cap company; Domino’s London, in the UK, is a $1.5 billion company. Alsea and Jubilant Foods, the Mexico and India franchisor, are $3 billion market cap businesses.
The agreements, which last for about a decade, will give the master franchisor the right to operate supply chain centers in the region. The agreements typically contain growth clauses requiring franchisees to open a minimum number of stores over the agreement.
International store count has grown much faster than domestic at an 8.9% clip per year since 2010. This can mainly be attributed to the incentives of the various master franchisors to increase sales and their autonomy to manage their business. Average AUV for international stores was $800k in 2021, slightly lower than that of the U.S., but with strong unit economics. These stores are also growing SSS at a much faster, 5.4%, cadence than their domestic counterparts over the last decade.
Supply Chain
On top of the asset light royalty collector, Domino’s operates a supply chain business that distributes cheese, sauce and dough to their restaurants. This vertical integration allows the parent company to manage the Domino’s brand by delivering consistent tasting products across stores whether that be in Seattle or Atlanta. This segment contributes 58.8% of revenue ($2.7bn) but only 26% of operating income ($230mn) because of its capital intensity and margins.
The company owns 26 dough manufacturing facilities and supply chain centers in the U.S. and Canada and two thin crust manufacturing plants. They also own a fleet of 900 tractors and trailers that handle delivery of dough out to restaurants.
Franchisees are not required to purchase ingredients from Domino’s supply chain segment, but the parent company has put in heavy incentives. Even in a competitive market, the scale of the operation allows the supply chain business to serve as a low-cost distributor for dough. By purchasing from the parent franchisees can ensure low cost raw materials (which allows them to have higher gross margins and EBITDA) as well as consistent, reliable ingredients which benefits the parent in building the brand. Because after all, a brand is a promise.
Domino’s also splits supply chain operating profits 50/50 with franchisees that purchase all of their supplies from Domino’s. The supply chain has an especially resilient margin profile as the largest good they distribute, cheese, is tied to the CME cheese price plus a supply chain markup. As cheese prices fluctuate, revenues and margin percentages in the segment will fluctuate, but the actual dollar margins remain unchanged giving us great visibility.
QSR Pizza Industry
Domino’s operates in the QSR Pizza industry, a sub segment of the $120 billion dollar global pizza industry. The global QSR Pizza industry is an $81 billion dollar industry split evenly between the U.S. and international growing at low to mid single digits.

QSR Pizza can be further segmented into delivery, carryout and dine-in. Domino’s operates in the first two as Dine-in is in secular decline. The industry is composed of a few large players (Domino’s, Pizza Hut, Papa John’s and Little Caesars) and tons of smaller operators. The industry structure is somewhat akin to pool equipment distribution in that relative market share is more important than absolute market share to have an advantage. Domino’s has roughly 22% of the $40B U.S. pizza market and has been stealing share from Papa John’s and Pizza-Hut since the Great Recession. The other chains combined own about 30% of the market and small regional chains or single stores make up the other ~48%.
Domino’s has been so successful stealing share from its competitors because of competitors’ original concept. Take Pizza Hut for example, the company emerged as a full-service dining concept with large square footage and comparably high real estate costs. Despite their attempts to convert to a QSR about 40% of the chain’s nearly 7,500 locations, or 3,000 restaurants, are dine-in units. As a result of the secular decline in dine-in and YUM Brands lack of focus on the struggling franchisee, Pizza Hut has struggled and been forced to close 3-4% of stores per year since 2015. Papa John’s has also faced the same struggle and had to close over 7% of stores in 2018. Domino’s, on the other had, has closed fewer than 0.5% of stores over the last five years and is on the path to continue to take share.

The delivery business is the larger revenue contributor accounting for 2/3 of sales and 57% of transactions but comes with lower margins due to its higher cost structure despite a higher ticket compared to carryout. A lot like waste management services, logistics operators and (surprise) food delivery businesses driver efficiency is key to profitability in this model. The efficiency of each driver is a function of the geographical coverage of a restaurant and the pay/hour for the delivery driver.
Carryout is the smaller but faster growing segment. This segment is structurally more profitable for stores as the customer’s deal with their own “delivery” allowing DPZ to cut on labor and fuel costs, but comes with lower ticket (43% of transactions but only ⅓ of revenue). In order to encourage carryout and build habit, Domino’s is tipping customers to come in and pick up their order.
The notable part about the delivery and carryout model is that, as former CEO Ritch Allison mentioned on their Q3 earnings call, “only about 15% of customers would go back and forth between the two [delivery and carry-out]” meaning that these sales are largely incremental and limit cannibalization. Carryout boosts sales and profit even though it has a lower average ticket. The chain’s strategy to fortress existing U.S. markets should boost net unit growth and contribute to carryout share gains, as store proximity is one of the largest factors for carryout clientele.
The carryout growth opportunity is the key reason behind Domino’s goal of having a store footprint of 8,000 U.S. restaurants by 2026. Greater store density will further increase carryout orders which primarily come from customers within a six-minute drive of a store. Domino’s carryout share has more than doubled since launching a $7.99 pizza deal in May 2011, and made up 45% of all Domino’s U.S. transactions and one-third of sales prior to the pandemic.
Moat:
The Domino’s moat is a really interesting case study, and frankly the reason I chose to do it as a write-up. It’s so different from the moats I’ve analyzed in the past. The strongest businesses in the world (the card networks, the hyperscalers and the credit ratings agencies) have built their moat around switching costs and network effects. Domino’s on the other hand has built their moat around process power and aligning their brand with being the low cost producer.
Domino’s has a built-in flywheel to their business that has allowed them to consistently grow units which have all kinds of impacts. First, Domino’s invests more in the stores which drives higher same-store sales, the higher same-store sales increases store profitability. As stores become more profitable, the franchisees have more money in their pockets to open more stores in their region which lowers delivery times. Lower delivery times means happier customers who order more pizza and on and on.
This idea of fortressing (adding new stores to areas that are outside of 2 miles of a Domino’s and increasing density) has been key to unit growth over the last decade. For example, if a franchisee has two stores in a market and the market begins to show signs that they are at capacity, Domino’s will inform that franchisee that they should open up another store in that region. By nature, this will cannibalize the SSS of the existing stores in the area, usually to the tune of 1-1.5% per year, however it helps propel the Domino’s flywheel and and adds some incremental sales as management has estimated that carryout sales at new locations are 80-90% incremental.
To make this more concrete, let’s walk through a few examples. In the first test market, Seattle, the average store in 2010 was doing a little over $14,000 in sales per week. Fast forward to 2017, this number grew to $26,000. The franchisee that was interviewed reported more fluid deliveries with the average delivery per hour increasing from 2.5 to 5, as well as a decrease in marketing spend. The overall impact of fortressing led to a >2x jump in profit per store from $67,000 to $158,000.

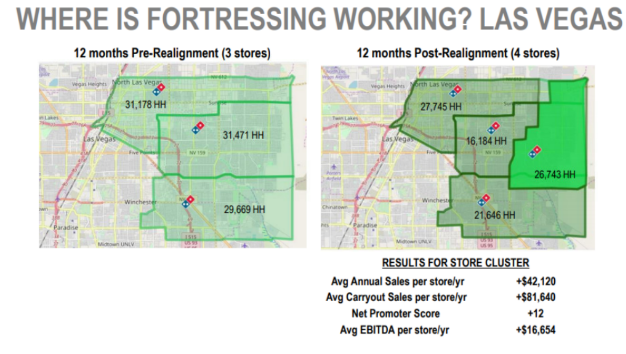
Again, in Las Vegas, we see the benefits of fortressing including higher store level EBITDA, incremental higher margin carryout sales and higher customer satisfaction (see NPS).
If you consider the flywheel again, as stores generate more sales, they can lower their delivery times by opening up an incremental store which makes customers happier and increases the region’s profitability for the franchisee as they reduce cost per delivery and encourage more carryout.
People are always seeking the path of least resistance, it’s biologically ingrained into us to save energy so it comes as no surprise that customers are building a preference for ordering in over eating out. Fast delivery times are a big part of this. Currently, Domino’s average delivery time globally is 22 minutes, which is already well ahead of other third-party deliverers that range from 40 minutes to more than an hour.
In short, they have phenomenal economies of scale that allow them to be the low cost producer and fortress an area which dissuades competitors from entering a saturated market. The company’s $5.99 delivery and $7.99 carryout offers are significantly lower than its other large QSR competitors after accounting for delivery fees.
Again everything comes back to healthy store level economics. Fortressing can only be accomplished if franchisees have enough cash to build out new stores. What are the highest input costs for restaurants? Food, real estate and labor. The Domino’s model has cut all of these down to the bone allowing them to be the low-cost producer.
Food. Domino’s is inherently more profitable than other franchised restaurants because of the nature of the food they sell. Zach Fuss explained on Invest Like The Best, “If you were to look at a pizza restaurant versus a burger joint, for instance, pizza generally starts with an 80% plus gross margin. The cost of dough, cheese, and sauce are just not that high. As opposed to a burger, which is dealing with the expense of protein. That business is going to be starting at like a 65% gross margin.”
Starting franchisees off with incremental 15% profitability is a huge competitive advantage. That additional margin has allowed them to fund delivery. Any potential franchisee is going to look at the universe of potential restaurants and their economics and weigh them against each other. The choice becomes clear, fast: Domino’s is a fantastic choice.
Real Estate. The fact that Domino’s leads with delivery means they can take lower-cost real estate. They don’t need to be at the busy intersection or in the strip mall where there’s a lot of foot traffic.In a way Domino’s has created one business model and just do it over and over again around the country in a way not too dissimilar from software.
All the stores are set up in the same fashion with limited seating and a compact kitchen. This is possible because all of the menu items, the pizza, pasta, wings or desserts all use the same oven and based on different entry times, all the food products complete their cooking at the same time. This allows them to shrink the kitchen (and therefore the store) requiring less space and therefore lower real estate costs which they can pass onto customers and be the low cost producer.
Labor. Finally, labor is a structurally lower cost at Domino’s because they don’t need staff to wait on you. Only 1 or 2 people are needed to man the store and cook the food while 2-3 others are out delivering the food.
Pizza is probably the best food for delivery purposes as it stays warm and is easy to stack which provides a small moat against other restaurant delivery. Also, DPZ’s dough is specifically made at the manufacturing sites to be suited for delivery. Independent restaurants can’t match this and other foods, take burgers and fries for example, means that drivers can’t deliver as many meals per trip.
Domino’s culture of relentless focus on efficiency, simplicity and technological innovation provides a distinct competitive advantage.The menu is kept simple to minimize order errors and expedite food preparation. The cost efficient stores centered around delivery and carryout require modest leases and maintenance cap-ex requirements which increase the value proposition to franchisees.
Domino’s has been fantastic at reacting to platform shifts. Since DPZ’s founding, pizza was a dial-in business where people called the store to place an order. Once the internet came along they opened up ordering that way and again with mobile. Today, 75% of their orders come through digital channels.
Just after the Great Recession, DPZ also implemented a unified POS system in all their stores giving headquarters visibility into store unit economics, sales, margins and other store-level data. Both the decision to remain top of funnel and retain the customer relationship by not outsourcing to third party food delivery networks has allowed Domino’s to aggregate a data advantage over competitors. They have better data around where to open new stores, what products to trial, how to push certain initiatives and how to price their product which gives them an advantage over other QSRs and more regional layers.
Their flexibility and ability to innovate can primarily be attributed to their relationship with franchisees. The fact that 95% of them managed a store or worked for Domino’s means that these aren’t PE guys looking to build their own business. Yum! Brands or McDonald’s have to deal with more private equity-type sponsor oriented owners and naturally lose bargaining power and flexibility.
In all, Domino’s process power and economies of scale allow them to be the low cost producer with a strong brand in a highly fragmented industry. Furthermore, their relationship with franchisees allows them to innovate and retain the customer relationship which provides them a data advantage. DPZ has a well entrenched franchise.
Competitive Threats and Risks
The current bear case for Domino’s has four prongs: third party aggregators, U.S. maturation, inflation and labor shortages.
The third party delivery aggregators (DoorDash, UberEats and Grubhub) could challenge Domino’s dominance in delivery and level the playing field for several of DPZ ‘s direct competitors in pizza as well as food more broadly. For literally decades pizza was the only food that could be delivered direct to home, third parties have shifted those dynamics.
Undoubtedly, aggregators have redirected consumer dollars as evidenced by the declining SSS growth in the industry prior to the pandemic. This shift was largely subsidized by VC dollars and heavy equity financing as the aggregators have come public which have allowed these companies to keep their cost artificially low. The promotional campaigns/discounts that are used to acquire customers will eventually run out of steam and investors in these businesses will begin to demand earnings over customer acquisition.


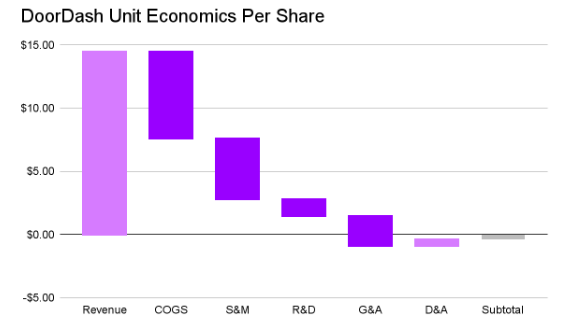
The unit economics of food delivery still seems a bit shaky despite high fees relative to average ticket size. Everyone has seen the Doordash sample unit economics from their S-1 showing that they have a 15% take rate on orders (which seems optimistic considering in their most recent 10K they showed a take rate of 11.5%). Grubhub has also conceded that it does not see a path to where it “can generate significant profits on just the logistics component of the business” due to its commodity nature which forces them to compete on costs and variable costs.
After the first onslaught from the aggregators, as Alphabridge points out in their Domino’s work, “we began to see unit growth of QSR pizza names begin to decline almost immediately. Between 2014 to 2018, the unit growth of top 500 limited-service pizza chains have declined from 1.9% in 2015 to 0.3% in 2018. In contrast, Domino’s has managed to increase its unit growth from 2.6% to 5.2% over the same period.” While definitely not a positive, Domino’s does have the opportunity to emerge stronger from this. Similar to how Amazon crushed the weaker retail concepts (department stores) those businesses that survived are in a decidedly stronger position (Costco, Autozone) with reduced competition. Domino’s has used the opportunity to seize market share as Papa John’s and Pizza Hut’s began closing stores
Pizza Hut is fighting an uphill battle as dine in is in secular decline and their large store concept and therefore higher rent structurally impact unit economics. Low same store sales growth and profitability for its franchisees has resulted in stagnant store growth and elevated closures. Papa Johns, on the other hand, seems to be undergoing a successful turnaround of its brand. They are attempting to differentiate themselves through higher quality products which negatively impacts franchise unit economics.
There is no doubt that there is a place for food delivery. People love pizza being delivered, no reason it doesn’t work for other foods as well. These businesses will struggle to compete with Domino’s on cost, however, but have unequivocally impacted DPZ’s SSS growth. On the labor front, drivers, rightfully so, prefer working independently on their own hours with the ability to pick and choose the highest value opportunities. For example grabbing a high ticket order or driving during surge pricing where drivers get paid more during busy times.
The recent deceleration in SSS has been driven by driver shortages due to the current state of the U.S. labor market. This has an outsized effect on the delivery segment, ⅔ of sales, that is not as pronounced on the carryout side. This seems to be a transient issue as management is laser focused on launching new hiring and training systems and has raised wages to attract new drivers. The real threat here is if it persists. A little market tightness happens and is not a reason to avoid the stock. You pay a high price for a blue sky. It’ll come and go. As long as the DPZ fast and convenient brand is intact this is a non-issue. We just have to monitor customer satisfaction closely.
In light of high inflation in labor and food costs, Domino’s recently refreshed its mix & match delivery offer by raising the price point from $5.99 to $6.99 and adding new products to the menu. This is the first time the company has increased the price on this offering in over twelve years. This seems to be the extent of the company’s pricing power. Inflation will have acute effects on input and wage costs for the business and impact margins, no doubt. Being the low cost producer in a heavily inflationary environment is a dual-edged sword. On one hand you have the lowest input costs which means you’re probably in a better position than competitors cost wise, but on the other hand you’re generally charging lower prices to consumers. It’s best to avoid raising prices and risk hurting the brand which puts DPZ in a tough position. All that is to say: I wonder if this business is resilient enough/ has the ability to raise prices to do well in a prolonged inflationary environment.
As an aside, as we will jump into in the next section, DPZ has undergone a series of recapitalizations to return cash to shareholders. This strategy has worked over the last decade and has been a key reason to the success of the stock. However, rates have been steadily falling over that period. As rates continue to rise substantially to offset inflation, DPZ’s strategy of running at 4-5x leverage and recaps every 2-3 years comes under question.
My final bear case is U.S. market saturation. Domino’s already has 6,560 stores and has stated the goal of reaching 8,000 stores by 2025. How much runway remains to continue adding U.S. stores? This is an important factor when considering the value of an incremental U.S. store vs the incremental International store. Assuming a US AUV of ~$1.4mn at a 6% royalty and compared to an international unit at a ~$0.8mn AUV with a 3% royalty, this would make the contribution of an additional average US store 3.5x more valuable than the average international store. As unit growth in the US slows,a consistent unit growth rate of 6-8% would not have the same benefit to shareholders that it may have had even 5 years ago.
Domino’s has undoubtedly been the strongest player in the industry emerging from headwinds better positioned than peers because of their focus on the customer. I believe that the most important variable to solve for is the likely pace and magnitude of domestic unit growth, after this year over the next 3+ years. If you can get comfortable that the cadence remains unchanged, then DPZ ‘s thesis is still intact.
Management and Capital Allocation:
Similar to other franchisors, a name that comes to mind is Hilton, Domino’s employs continuous leveraged recap process. Since 2015, they’ve undergone 5 recaps. They can do this because of the stability and light nature of their business which Domino’s takes advantage of by operating with a high amount of leverage. DPZ uses these recaps as a method to free up cash to return to shareholders through substantial buybacks and a dividend. Domino’s has decreased shares outstanding by more than 5% annually since 2015 when the recap program really got underway.
Alongside fourth quarter results in early March, Domino’s announced that Russell Weiner, former COO and President of Domino’s U.S., would take over the CEO position due to the retirement of Ritch Allison. Weiner joined Domino’s as Chief Marketing Officer in 2008,and led the Pizza Turnaround campaign, which revitalized the Domino’s brand and led to 7% average U.S. same-store sales growth over the subsequent twelve years. DPZ also hired a new CFO, Sandeep Reddy, from Six Flags who started in early April.
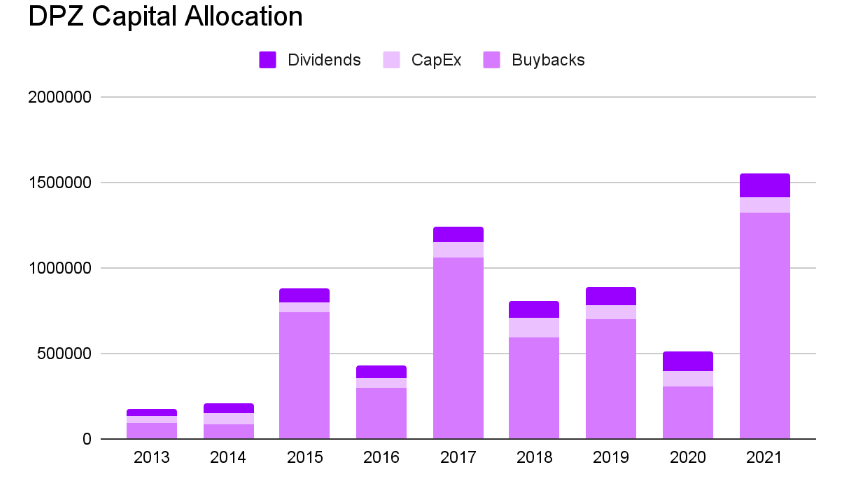
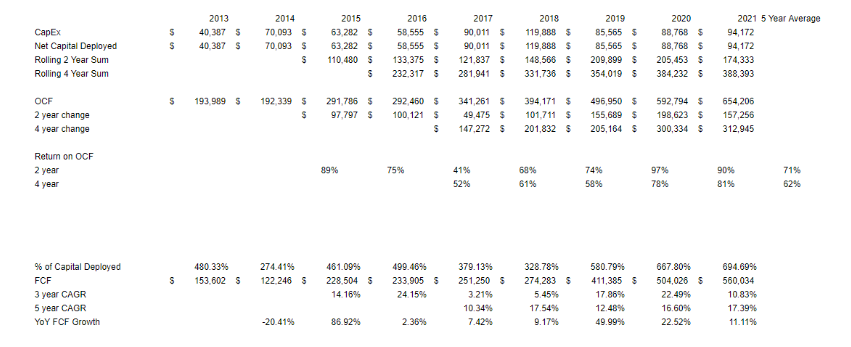
Over the past five years Domino’s has retained 20% of operating cash flow, or $710M, to reinvest into the supply chain business and some company-owned store cap-ex. Domino’s has returned nearly $6 billion to shareholders through buybacks and dividends since 2013 which is 75% more than cash from operations as a result of their heavy debt issuance (up from $1.5bn in 2013 to $5bn in 2021). The company generally stays within a band of 4-5x leverage. EBITDA coverage has historically been 4.5x interest.
Cap-ex spend has historically been on investments in technology initiatives (for example the unified POS system and digital ordering platform), supply chain centers, and company-owned stores builds or remodels.
Domino’s has incredibly high returns on capital due to the asset light nature of the business. The royalties are 100% margin, franchisees bear all of the startup costs to open new stores and pay for their own store cap-ex. Even in the supply chain business cap-ex only makes up 1.5% of revenues. I estimate that the company earns 60%-70% returns on invested capital, but intrinsic value growth is constrained by the lack of places to reinvest.
Valuation
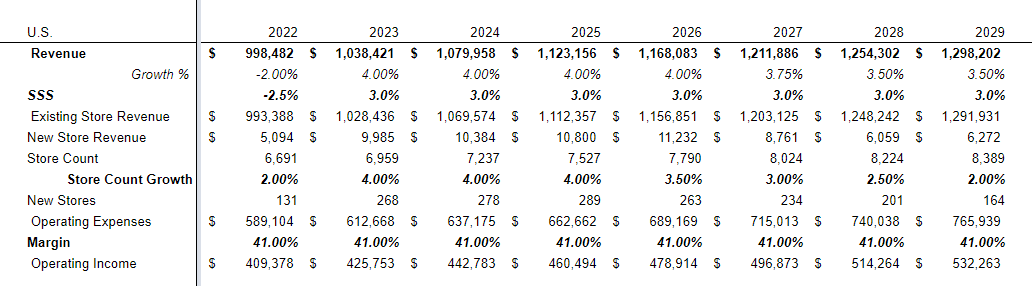
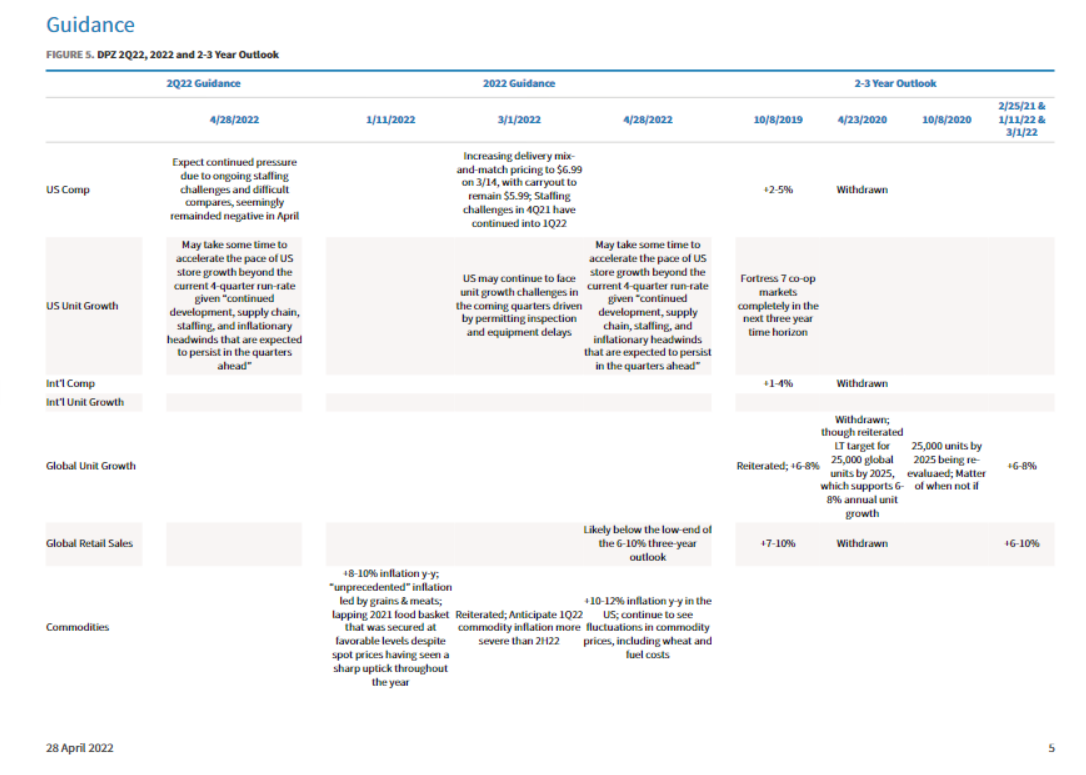
Starting with the U.S. stores segment (I’ve lumped in company-owned stores and royalties in together) 3.8% sales CAGR through 2029 is driven by SSS of 3.9% and 3.3% store count growth. Domino’s U.S. store growth will re-accelerate to pre-pandemic levels due to attractive unit economics and the company’s fortressing strategy despite labor shortages. This is markedly slower than the needed pace for the company’s stated goal of 8,000 US stores by year end 2025, but falls in line with management’s guidance that, “it will take some time to accelerate the pace [of new store builds] beyond the current four quarter run-rate.” I also permanently suppress margins to 41% in line with 2019 levels.
The supply chain segment is simple to model out. I chose to fade revenue 0.50% every two years from an original 8% growth rate to account for the slowing of the U.S. segment. This segment has grown at 11% over the last 6 years. I model operating margin at 8.5% compared to a historical 9.3%.

For the international segment I have modeled a 7.5% revenue CAGR through 2029 fueled by 2.5% SSS and 7% store count growth. Underpinning my segment operating income is an 80% royalty margin in line with past performance

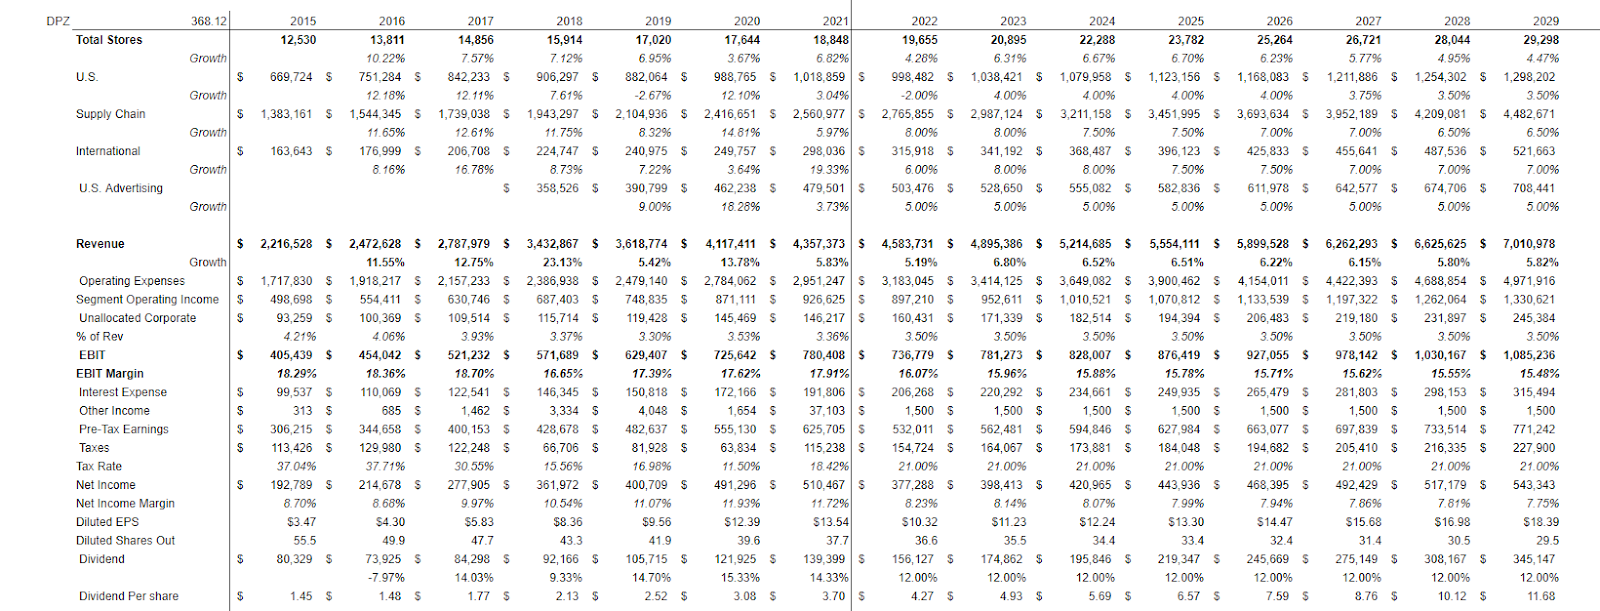
My company-wide income statement model is below. The key assumptions are 5.5% total unit growth, 6% revenue growth, EBIT margin in the mid teens leading to net income growth of 7.8%, 3% shares retired per year.
Here is my FCF calculation with those assumptions and the projected IRR.
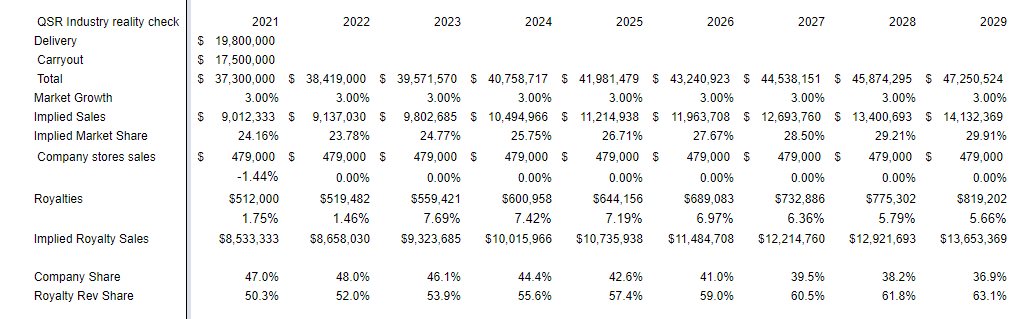
I also wanted to do a reality check of these assumptions in relation to the broader QSR pizza industry. Delivery segment dollars of $19.8 billion in 2021 was up from $13.1 billion in 2016. Over the same period, carryout in the U.S. grew from $16.3 billion to $17.5 billion. This represents a 4.8% CAGR. The assumption below models out a market CAGR of 3%, flat company-owned store revenue and U.S. segment growth fueled entirely by the franchise’s stores. This yields Domino’s highest possible market share in accordance with my models above. In this case Domino’s grows by 575bps by 2029 and controls 29% of the U.S. QSR Pizza market.
Thank you for reading!
Appendix:

Bibliography:
Invest Like the Best with Zach Fuss: Breaking Down the Food Ecosystem
ICR Presentation
Alpha Bridge Write-Up
Eagle Point Capital
Young Hamilton Write-Up
Pershing Square Presentation
JPM and Deutsche Bank Sell side notes
DoorDash Unit Economics
Nobody Wins With DoorDash
DoorDash the value of speed
Credit Suisse Note January 2020
UK Investor Presentation January 2019
ICR Presentation
The Qs, Ks and Earnings Calls
Disclosure
I do not own any shares of $DPZ. I am not a financial advisor. These articles are for educational purposes only. Investing of any kind involves risk. Your investments are solely your responsibility and we do not provide personalized investment advice. It is crucial that you conduct your own research. I am merely sharing my opinion with no guarantee of gains or losses on investments. Please consult your financial or tax professional prior to making an investment.