Published: 12/18/21
Author: Ben Tewey

Introduction
S&P Global’s (“SPGI” “Standard and Poor’s” or “S&P”) heritage dates back to the early days of the burgeoning railroad industry in 1860 when the company initially provided historic information on the industry to help investors make more informed decisions. However, it was until 1916 did the company report its first credit rating, what is it now famous for today. In 1966 Standard & Poor’s was acquired by McGraw-Hill where it resided for 47 years until the sale of the education segment in 2013 resulting in the remainco McGraw-Hill Financial later renamed S&P Global. Since its humble beginnings, Standard and Poor’s has developed into a leading provider of credit rating assessments, indices, information for commodity and energy markets and analytics for investment professionals. Over the last decade (12/12,/2011 to the close on 12/10/21) S&P has returned 27.2% CAGR, significantly outperforming the S&P 500.
The company generates 61% of its revenues in the U.S. and 39% internationally. SPGI has four diverse business segments operating in the $12.7B dollar credit rating industry, $4.1B index provider industry as well providing data, analytics and benchmark prices for commodities and a financial data platform. The chart below disaggregates SPGI’s revenue by segment since 2011, all figures, except years, are in billions. In 2020, the company did $7.4Bn in revenue and had a market cap of 112 billion.
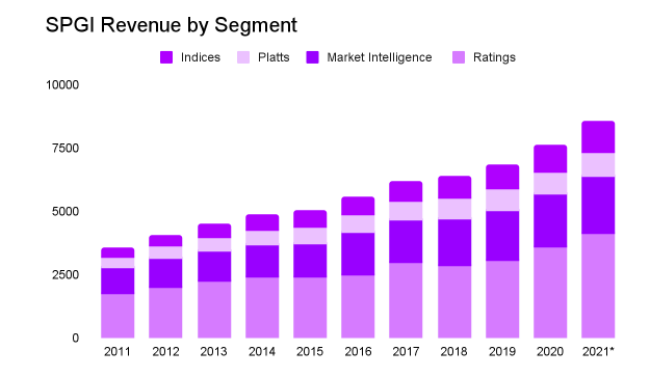
*Estimate for full year 21.
SPGI’s revenues are comprised of:
Transaction Revenue (56%): Primarily consists of new ratings
Non-transaction revenue (44%): Primarily consists of subscription fees for data, analytics, ESG, indices, and credit surveillance
Segment Analysis
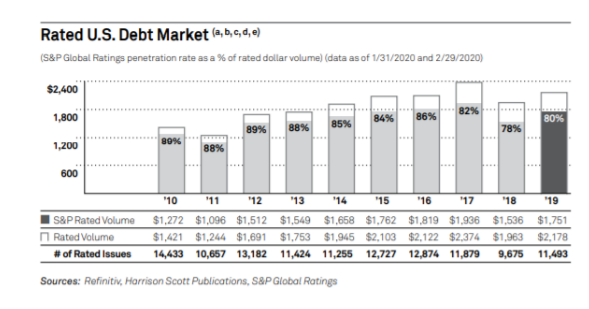
Ratings is Standard and Poor’s largest segment by revenue. Ratings comprises 47.6% of revenue and contributes 56.5% of operating profit with an outstanding 65% operating margin. It provides credit ratings, research, and analytics to investors. As demonstrated below, Ratings cumulatively has over 1 million credit ratings outstanding and in effect has rated practically every relevant corporate, government and structured finance debt instrument, bank loan and corporation in the United States.
Ratings, protected by regulatory barriers to entry, brand and historical accuracy, has compounded revenues at 7.4% annually since 2011 while exemplifying tremendous operating leverage as operating margins have expanded 25% over the decade to 65%. To provide context, the business did $3.6B in revenue in 2020 and brought in $2.3B in operating profit.
Ratings’ initiation and surveillance revenue has high incremental margins due to its primarily fixed cost nature. The primary expense is SG&A as the company must maintain the staff to survey the 1,000,000+ ratings outstanding. The segment has actually commanded less capital investment over time as annual cap ex has fallen 31% since 2015 to $33mn or only 1% of revenues. However, revenue has not been negatively impacted by the reduced investment and has continued its steady CAGR.
This speaks to the idiosyncratic characteristics of the ratings industry. The credit rating industry is dominated by the three largest firms, Moody’s, Standard & Poor’s, and Fitch which according to the Annual NRSRO Report by the SEC combined issued 95.1% of all credit ratings outstanding in 2020 in the US (the story is much the same in Europe at 90%). S&P issued the most ratings, 50.1%, in the oligopoly.
This is an inherently moaty industry to enter but the barriers to entry between the players are low. Whatever Moody’s offers, S&P can offer the same. Industry players do not directly compete with one another for revenue, however. This is not a traditional winner-takes-all industry. Instead, issuers will often seek at least two, if not more, opinions on their debt. This allows for MCO and SPGI to have the potential to each have 100% market share by rating all issues outstanding.
The three largest credit ratings agencies (“CRAs”) (Moody’s, Standard & Poor’s, and Fitch) employ an “issuer-pays” model whereby Company X will pay the CRA to rate their debt issue. The model, plainly, creates a conflict of interest. The company paying the CRA is the one being rated, increasing the likelihood of a favorable rating for the issuer. If an issuer received a rating they felt was unfair, they would simply go to another CRA for a more “lenient” appraisal.
The alternative is an Investor-pays model, which the industry strayed away from in the 1970s. An investor-pays model generates revenue through individuals or organizations having to subscribe to see the CRAs rating. CRAs moved away from this model as they realized they could foster network effects and stronger economic moats in the issuer pays model.
The issuer-pays model allows the CRAs to publish their ratings to the public for free. This creates brand loyalty as firms must have a lengthy track record of ratings in order to provide known reliable results. Investors then become more likely to rely on the more transparent CRA, creating demand for their ratings. This leads issuers to seek out a rating from that CRA creating a network effect. All issuers go to CRA A because all consumers trust CRA A.
A second barrier to entry is that a new rating agency would need to establish a relationship with the plethora of entities that issue debt. Simply put, there is no reason you would opt for an unknown CRA when SPGI, Moody’s, and Fitch provide well-known, reliable and widely accepted services.
Issuer-pays has come under scrutiny since the GFC, as the CRAs were accused of misleading investors by over-rating risky securities. It is unlikely, however, the business model will change in the coming years. Political opposition and threatened reform has proved difficult to pass.
To further insulate their industry the aforementioned regulatory barriers to entry are high. There are currently only 9 Nationally Recognized Statistical Ratings Organizations (NRSROs) by the SEC. This status gives weight and validity to an NRSRO opinion over any random firm.
CRAs hold a toll-like position for issuers to access public capital. Issuers will seek a rating for three main reasons:
- To have an independent assessment of credit to provide validity for investors;
- Access to better terms on debt if the rating is favorable which in turn lowers interest;
- OR a rating allows more parties to invest (many managers can’t buy unrated securities as they may be speculative)
Ratings disaggregates its revenue between transaction (55% of revenue) and non-transaction (45%). Transaction revenue primarily includes fees associated with rating initiations on new issuances of corporate, government and structured finance debt instruments, bank loan ratings and corporate credit estimates. An entity looking to raise capital in the market will go to a CRA for a rating whether it be a sovereign nation or a micro cap company. Non-Transaction revenue includes fees for continued surveillance of a credit rating 9(annual updates) and fees for credit ratings and research at CRISIL. Non-transaction revenues within Ratings are high margin recurring revenues with virtually no churn until maturity.
The primary revenue driver for the segment is corporate debt outstanding as corporate products make up 60% of the Ratings revenue. M&A activity is a primary catalyst for increasing corporate debt outstanding and therefore bodes well for SPGI. Additionally, a lower interest rate environment acts as a tailwind.
SPGI and MCO are the two largest players in the industry. Standard and Poor’s did $400mn more in revenue in 2020 than Moody’s and had a 3% wider operating margin.
2020 was a particularly strong year for the ratings segment as borrowers’ need for increased liquidity in light of the pandemic-related economic downturn, historically low borrowing costs, and central bank lending actions initially announced at the end of the first quarter of 2020 encouraged companies to take on more debt.
Ratings has experienced secular tailwinds as total dollar volume of debt outstanding continues to increase alongside the percentage of nonfinancial corporate-debt-to GDP.

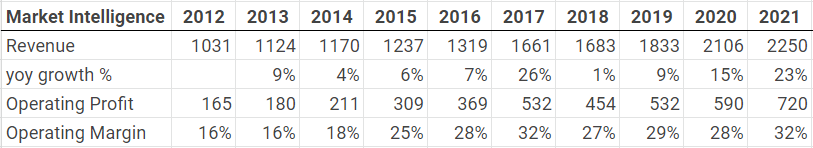
Market Intelligence is SPGI’s second largest segment by revenue (28%), but has the lowest operating margins at 32%. MI offers services which distribute data, analytics, and research. Desktop (52% of segment revenues) primarily targets finance professionals with products such as Capital IQ and SNL desktop which has information on 88,000 publicly listed companies representing 99% of the global market cap. Data Management Solutions (19% of segment revenue) provides customizable data feeds with information on active and inactive companies, indices, industries, and earnings data, compiled from filings by nearly all public companies.
Lastly, Credit Risk Solutions (29%) is the commercial branch of Markets Intelligence which sells data on Ratings’ assessments.
Market Intelligence plays an important role in the SPGI ecosystem as 97% (or $2.05B) of its revenue is subscription based with over a 96% retention rate as of the latest investor day presentation in 2018 and 230,000 active users. This segment provides resilient, visible cash flows when the Ratings business experiences cyclicality, stabilizing the overall business’s top line. It also acts as a cross selling opportunity for SPGI’s Ratings segment directly to MI customers. On top of this the business only requires $30-40mn in cap ex annually, therefore generating high returns on capital. The outstanding retention rate is driven by the fact that MI’s products are deeply embedded in client workflows.
There are high switching costs due to the time investment of switching over systems and getting comfortable with a new service leading to a very sticky customer base (half of Market Intelligence’s customer base are investment bankers and managers with the remainder made up by PE, commercial banks and insurance). As a result this client base is generally unmotivated to churn. Client retention has trended upward as MI has expanded its offerings to cover private and international markets.
Market Intelligence’s primary competitors are Bloomberg, Refintiv and FactSet. MI is strengthening its competitive position through expanding offerings and ESG analytics. This segment has generally grown slower than the other businesses within SPGI and management stated in the 2018 investor presentation that the financial data and analytics market is growing at 3-4% annually. We can assume that with slight market share gains, expansion into new categories such as private company coverage and geographies (ASian markets) and pricing grab due to the high retention MI revenue will continue to grow in line with management guidance in the mid to high single digits.
Platts fills a similar strategic niche to Market Intelligence in the SPGI ecosystem providing resilient subscription revenue to insulate the company when Ratings revenue slows down due to economic cycles or investor mood. The segment has grown revenue 228% since 2011 (7.8% CAGR) and should do just shy of $1bn in 2021 on 55% operating margins. Platts provides information and benchmark prices for the commodity and energy markets.
Platts’ revenue is primarily (68%) international and subscription based (92%) providing geographic diversification and stability. The business generates very sticky revenue with 94% renewal rates and high switching costs through embedding itself in customer workflow. Platts offers subscriptions to real-time news, market data and price assessments with small portions from licensing data to exchanges, conference sponsorship, consulting engagements, and events. Over time, customers build a familiarity and proficiency in Platts that makes them dependent on the product and unlikely to switch providers.

As seen above, Petroleum is the primary revenue driver for Platts accounting for 60% of revenues historically. Platts is set to continue its mid single digit growth in 2021 and should do revenue in the ballpark of $950mn with only $10mn in cap ex. Segment revenue is dictated by trading volumes and as Platts extends coverage to different geographies, with a special focus on China, and more and more exchanges settle prices based on Platts data, volume will continue to climb and revenues will follow.
Indices is SPGI’s highest margin segment and has grown revenues 255% since 2012 (10.9% CAGR) while experiencing operating leverage as operating margins have expanded to an outstanding 67% as of 2020 and 70% as of Q3 ’21. SPGI manages hundreds of thousands of indices and over a quarter of all ETFs are linked to an S&P Dow Jones index. This is the company’s most recognizable segment with brands such as the S&P 500 benchmark and the Dow Jones Industrial Average. As of YE20 SPGI has more than $19tn benchmarked to their indices and $2.5tn of assets under management (AUM) for ETFs as of Q3 ‘21.
SPGI Indices cover a broad range of asset classes, industries, factors (such as momentum, volatility etc) and ESG as well as provides a tool to customize indices. As of 3Q21 Indices derives 70% of its revenues from asset linked fees tied to AUM levels, 16% from recurring subscription revenue and 14% from sales-usage based royalties.
SPGI AUM levels have consistently grown 16% per year since 2012 driven by the shift from active to passive asset management and increased demand for custom indexing. Since Indices began reporting asset-linked fees revenue in 2015 revenues have grown 11% annually through the TTM to $768mn.

The growth in asset-linked fee revenue is even more impressive as SPGI has been faced with significant fee compression from the ETF providers. Enlightened Capital outlined the situation in his MSCI deep dive (highly recommended), “driven by continued pressure from the large passive managers: BLK, Vanguard and SSGA who control ~70% of the ETF market…[a]sset managers have faced fee compression over time across active and passive strategies and have pushed on index providers to lower their fees as well.” As can be seen below, Indices asset linked fees as a % of AUM has steadily declined, but revenue continues to grow as AUM growth offsets the compression. While this may be a form of shared economies scale, judging by recent comments by the MSCI management team it is primarily involuntary.

Indices has numerous secular tailwinds propelling it including the aforementioned shift to passive investing. Since John Bogle pioneered the index fund industry with the Vanguard Group in 1975 the trend has been driven by lower fees for ETF’s/Index funds relative to actively managed funds. Accelerated inflows to passive funds have been driven by significant underperformance by actively managed funds since the GFC. Going forward, there is still plenty of actively managed capital to grab (47% of funds invested in U.S. equities are actively managed) as shown below as well as high growth in ESG and customized indices. Management has guided to low double digit returns for the foreseeable future.

Indices has a wide moat driven by significant barriers to entry, high switching costs for asset managers to switch their benchmark and brand recognition. The S&P Dow Jones name is the most recognizable index name in the world. With over $19tn of assets tied to the indices, S&P is the default benchmark globally. In addition, Indices also owns the SPY and SPDR sector indices which have over $240Bn indexed to them as of 21Q3.
Secondly, there are high switching costs in Indices. Once a benchmark is chosen, very rarely are benchmarks changed. This goes for managers tracking performance to an index and the large ETF providers, who very rarely change their benchmarks due to liquidity, and tax considerations.
The high incremental margins inherent to this business likely make higher margins over time inevitabile. However, management has stated they are more focused on revenue growth here than margin expansion at this stage.Margin expansion will likely be slower than the historical figure due to the recent explosive growth. Can only squeeze an orange so much before juice stops flowing out. Due to the capital light nature, high margins and strong secular tailwinds we have seen Indices become one of the two most important revenue streams for SPGI over the last decade.

Management and Capital Allocation
SPGI has a dominant and defensive business model, but of course we have to dig into the people running the business and their incentives which will ultimately determine capital allocation.
S&P’s costs are largely fixed, so any growth in earnings will flow through as free cash flow as their various business segments require very little invested capital and minimum capital expenditures. At this point reinvestment in this business is nearly all maintenance related. This trend has been exemplified as SPGI’s cap ex as a % of revenue has steadily fallen since 2011, as shown below.

Increasing revenues and a management team maniacally focused on cutting expenses has led to significant margin expansion over time. Notably, Ratings has expanded margins 2500 Bps and Platts 2700 bps. As these businesses have scaled we have seen incredible margin expansion over the past decade driving stock returns. This should continue, albeit at a slower pace, as Indices and Ratings (the two highest margin businesses) revenue growth continues to outpace the other two segments.

The question then becomes: how has management chosen to spend the $15.3Bn of free cash flow the company has generated since 2011? Quite simply they have done what every business’s eventual goal is: return cash to shareholders.

Over the last decade Standard and Poors has spent over 82% of capital deployed, or $12.5Bn, on share repurchases and dividends. This has led to a 57 million share count reduction or 20% of total shares outstanding. The capital light essence of SPGI is highlighted by only ~6% of capital being spent on reinvestment in the business as cap ex.
Management has also demonstrated an ability to make sensible bolt on acquisitions to bolster the ecosystem’s offerings over time. In any given year they will make a half dozen minor acquisitions with a deal size less than $50mn. The two largest acquisitions recently have been SNL Financial which added to the MI segment in 2015 for $2.2bn and Kensho for $550mn to use their AI in data and analytics.
The elephant in the room is IHS Markit. S&P and IHS announced a merger in November 2020. The $44Bn merger is set to close in the first quarter of 2022. Initial terms are that each share of IHS Market will be exchanged for 0.2838 shares of S&P Global and that SPGI shareholders will hold 67.75% of the new company. The pro forma company generated 11.6B in combined revenues in 2020. S&P announced on their Q3 earnings calls that IHS Markit will divest OPIS, Coal, Metals & Mining (CMM), and PetroChem Wire businesses to News Corp, divest its Base Chemicals business and that S&P Global will divest CUSIP Global Services and Leveraged Commentary and Data, together with a related family of leveraged loan indices.
The two businesses have very complementary models. 88% of IHS Markit’s revenue is recurring with a very sticky customer base of large corporations (80% of the Global Fortune 500) and will reduce the importance of the Ratings business on S&P’s side. This is a merger that will significantly boost the MI segment. Below is a slide form the initial merger announcement last November. S&P later went on to estimate the company’s TAM to be in the range of $20Bn growing at HSD per annum.

Initial projections put out indicate that the pro forma company will be able to grow revenue in the range of 6.5-8% per year, expand margin 2% per year through 2024 and spit off $14bn in free cash flow cumulatively in the first 3 years. What puzzles me most is the ppdated merger synergies forecasted. They predict cost advantages, that they somehow had not found for an entire year the merger had been announced and also increased revenue synergies despite more divestitures. I find some of the predictions to be too rose colored. Additionally I will add any merger that takes more than a year with a significant delay that requires regulatory approval makes me hesitant of its materialization.
Management has been able to provide high returns on very limited capital deployed because SPGI is so asset light. We estimate that return on invested capital has been anywhere between 55% and 86% over the last decade. Capital deployed is the sum of capital expenditures and acquisitions (I originally wanted to net for dispositions, but this gave negative returns in some years because dispositions were greater than capital deployed). Adjusted operating cash flows is cash flow from operations net of one time legal fees for a more normalized look at operating cash flows.

Over management has a solid track record of capital allocation. I expect modest margin expansion due to recent explosive growth and ROIC to trend higher as capital requirements stay the same. Management has stated that they aim to return 85% of free cash flow to shareholders in the form of repurchases and dividends. Looking out, I expect a similar capital allocation approach, with SPGI returning 85% of free cash flow and the rest to go to bolt-on acquisitions. It is unfortunate that SPGI has pursued large scale M&A as this is generally a value destroying activity.
Upsettingly none of SPGI’s managers own above 1% of the outstanding stock, in fact the entire board combined own only 0.1% of outstanding shares. Management is primarily rewarded for growth in Adjusted Revenue, Adjusted EBITA Margin and Adjusted EPS. This incentivizes growth at any costs and share repurchases regardless of relation to intrinsic value which does not align shareholders and managers. I would prefer to see compensation tied to ROIC or FCF per share. I can not gripe too much as total returns have been phenomenal.
Risks
The most pressing risks to SPGI are a legislative change to the issuer pays business model which would erode their economic moat and substantially impact the Ratings business. Cyclicality due to downturns in the Ratings business. The mitigant is that debt issuance slowdowns due to economic shocks are nothing new to CRAs. Historically, the deceleration has been short-lived, while other company-specific levers prevent mass carnage
SPGI may also fail to perform in their shift to foregin markets, which we will touch on later. Corporate debt ratings, in a country unfamiliar with legitimate assessment, may create a reality check that doesn’t sit well with domestic Chinese firms. This would result in diminishing opportunities for SPGI to garner business.
If we enter a lost decade due to high prices on the indexes like we did after 1999 we could see the growth of Indices slow.
The most pressing risk is the failure of the IHS Markit merger. If this proves to be value destructive the thesis would be broken.
Optionality and Outlook
As long as corporations, governments, and other entities continue to tap the capital markets to raise funds from their debt securities, a need for ratings will always exist. Without a fair rating, regulated financial institutions won’t be able to hold the potentially speculative investment, and investors will opt for investments that are transparent in their risk levels. If an investor has no accurate and consistent method to measure the creditworthiness of debt, he or she will likely be unwilling to purchase the debt due to the uncertainty pertaining to its quality. The size and stability of the current international credit market would not be what it is today without credit agencies, andas a result, credit rating agencies are essential to continuing the existence and operation of debt markets.
Future growth in Ratings will stem from the ongoing secular trend of borrowers using bonds to access capital as opposed to loans. Emerging markets also have the opportunity to increase their non-financial corporate debt to GDP ratios in line with more mature economies (105% average as of Q3 2021). Latin America’s average corporate debt to GDP is 50% below the global average. China, whose corporate debt to GDP ratio is 30% above the global average, also presents a greenfield opportunity for S&P. Below is a chart of corporate debt as a % of GDP in 2020 as 2021 numbers have not been released yet.
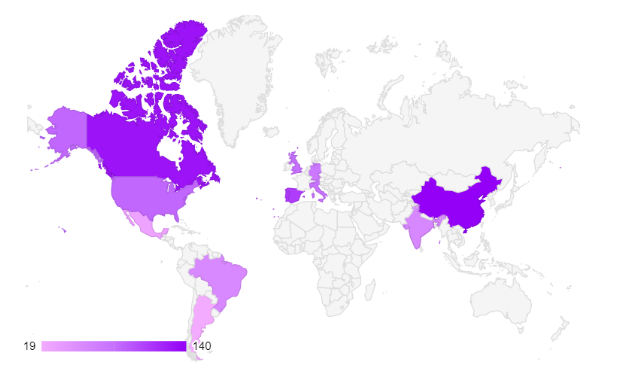
China’s domestic corporate debt market has exploded since 2008, growing to $13.0T in total with annual issuance of $1Tn making China the 3rd largest debt market in the world (government and corporate combined) behind the US and Europe. S&P was the first company approved for a wholly owned subsidiary in China and issued its first rating in June of 2019. Through Q3 2021, S&P has issued 46 ratings in China up from 22 last year. This is a complete greenfield operation that should continue to grow well into the future and offer substantial volume.


In more mature regions such as the US Ratings can gain market share in structured finance products such as CDO, RMBS, and CMBS. Structured finance has a rated volume, securities that already have a rating outstanding, of $580Bn. S&P rated $292Bn or 50.3% of this market significantly below their average rated volume of 80% in the U.S. debt market as a whole. Specific gains will come in the $227Bn asset backed securities market where they have rated only 63% (as opposed to 70% historically) and $114Bn residential mortgage backed securities market where they only rate 29% of the market.

Lastly, management has stated that Ratings has a strong outlook due to the $12Tn of maturities between H1 2020 and 2025 which is often followed by an onslaught of new issuances which will be a boon for transaction volume. Global issuance will continue its steady 2% increase per year, in line with long term GDP outlook.
Indices should sustain low double digit growth in revenue as a result of the ongoing shift of active to passive increasing AUM and therefore asset linked fee revenue with still significant capital inflows. MI will have mid single digit long term revenue growth with moderate margin expansion as management is incentivized to do so. Platts will continue to increase trading volumes and revenue should continue mid single digit growth.
SPGI Valuation
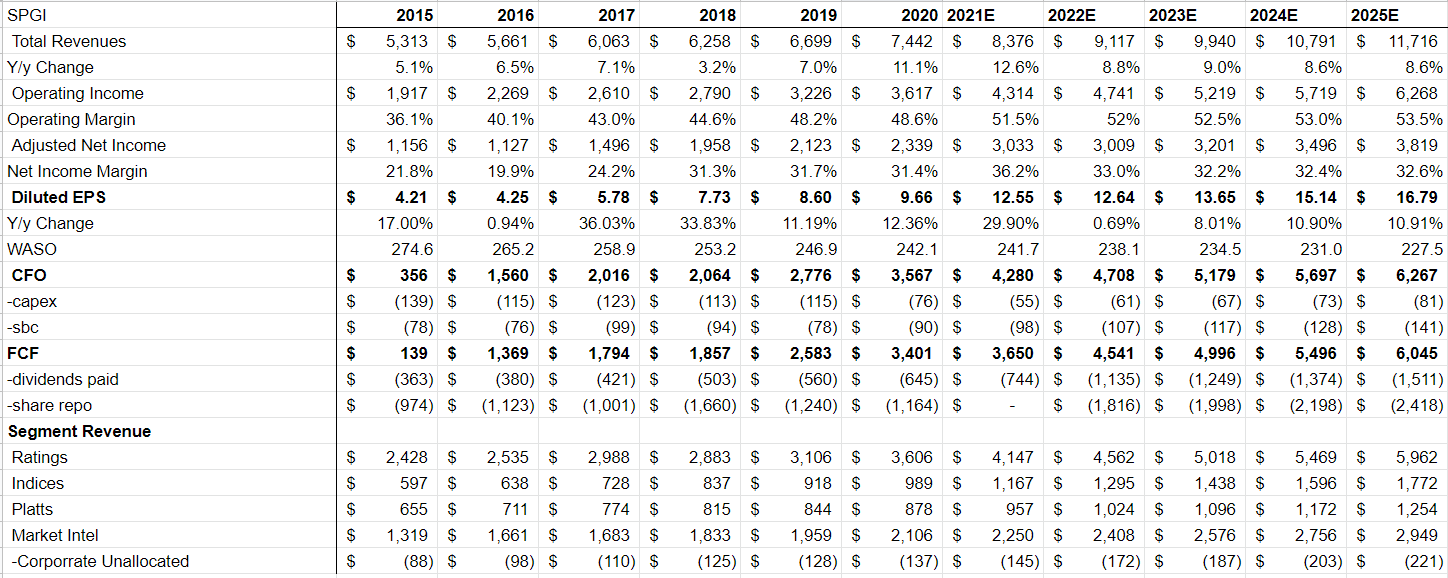
According to my model below Standard and Poor’s presents a satisfactory investment opportunity. It is a dominant player in a moaty industry that requires little to no capital and earns a high return on invested capital. To achieve an 8% IRR SPGI would need to grow 10% free cash growth per year through 2025, in line with historical averages since 2011 and trade at a 25x FCF multiple. Not terribly demanding, but there are better opportunities.
I forecasted high single digit revenue growth and a free cash flow margin around 43% (in line with 2020 but meaningfully higher than historic average). Operating margin continues to climb as a result of the fixed cost nature of the business. EPS growth is driven by 7.8% revenue growth, net income margin expansion of 140 bps and 1.5% reduction in shares outstanding per year.
This is the type of business I would like to own, however there are higher, more certain, IRR opportunities in the market that I am tracking. Stay tuned for those.
Conclusion
Standard and Poor’s is a strong, diversified business that will grow the top line in mid to high single digits for long term. The company has strong network effects, brand recognition and regulatory barriers to entry protecting its Ratings segment. Platts and Market Intelligence are protected by high switching costs and have high renewal rates as a result. Indices is the highest margin segment with strong secular tailwinds due to the shift from active to passive which still has an underrated runway to go. Reinvestment potential is low as there is little requirement for cap ex, but returns on capital are extraordinary leading to high teens intrinsic value growth. This coupled with share buybacks has resulted in low twenties intrinsic value per share growth over the last decade. As a share price of $468.00 SPGI has the potential to return 8% CAGR through 2025.
Disclosure
I do not, as of 12/16/21, own any shares of $SPGI or $MCO. I am not a financial advisor. These articles are for educational purposes only. Investing of any kind involves risk. Your investments are solely your responsibility and we do not provide personalized investment advice. It is crucial that you conduct your own research. I am merely sharing my opinion with no guarantee of gains or losses on investments. Please consult your financial or tax professional prior to making an investment.
Bibliography
- 2020 10K
- Investor Relations
- Investor Presentation June
- SPGI Quarterly Earnings Directory
- SPGI 2020 FactBook
- BamSEC SPGI Directory
- SPGI Description of the Credit Rating Business
- Credit Ratings Scholarly Articles
- Industry Paper
- Temple Initiation report
- Credit Suisse Presentation
- 2021 SPGI Proxy Statement
- Q3 Earnings Slides
- HBS on Credit Rating Competition
- OECD on Credit Rating Competition
- Fifth Person SPGI and MCO report
- MSCI 10K
- MCO 10K
- SPGI on their Index Business
- 2018 Investor Day Slides
- Q4 Slide
- UBS Conference Slides
- UBS Conference Presentation
- Annual NRSROS Report by SEC
- Enlightened Capital MSCI Deep Dive
- Index Industry Primer
- Bloomberg on Active vs Passive