Author: Ben Tewey
Published: 8/3/21

Introduction
Visa ($V) is one of the world’s largest digital payment networks. They act as the intermediary for nearly half of the world’s digital transactions. In every digital exchange there are five parties: the issuing bank, the consumer, the acquiring bank, the merchant and a payment network i.e. Visa, MasterCard etc.
Payment networks (particularly Visa and MasterCard) have the deepest moats of practically any business in the public markets. The model’s scale economies, network economies, switching costs, strong pricing power, and a high barrier to entry due to their intermediary role is almost insurmountable for a new entrant. This is evidenced by Square and PayPal opting to partner with as opposed to compete against Visa or MasterCard.
Mine Safety honed in on Visa’s role in the transaction world in his analysis well, writing, “Because there are thousands of banks, millions of merchants, and billions of consumers, it would be far too complex for every entity to have a direct relationship with every other entity. In short, Visa acts as a centralized operator, developing technology, maintaining infrastructure, and setting operating standards for all parties.”
The company facilities, enables, and transfers digital payments through its debit/credit/ and prepaid cards. It earns revenue by taking a cut of each payment.
Visa should grow earnings by 11-13% over the next decade. The company employs an attractive business model with recurring revenue as a so-called “royalty on economic spending.” As Visa continues to scale, the company enjoys increased operating leverage as well which bodes well for margin expansion in the future. They operate in an oligopolistic industry and will benefit from the secular shift to digital payments from cash and check. None of this is unknown by the market and as we will touch on in the “Valuation and Outlook Section” at the end.
So join me on a walk through Visa’s forest.
Revenue Streams and KPIs
There is no doubt that you have seen or used a Visa debit/credit/or prepaid card. The company is seen across more than 200 countries and territories with 3.6 billion cards, 16,500 banks, and 70 million merchants (despite only counting Square and PayPal as one merchant).
Visa has a significant recurring revenue stream and consistently monetizes their customer base. I absolutely love the business model– anytime a cardholder engages in a transaction Visa receives a $0.07 cut plus 0.11% of the total payment for that transaction from the merchant. This allows Visa to consistently monetize their growing customer base (measured by ever increasing merchants and issued cards) as payment volume (total dollars spent) continues to grow.
Visa is a $550B company by market cap that did $21.8B in net revenues in 2020. They are on pace to top that this year already booking $11.4 billion in revenue in H1 ‘21 (Visa’s fiscal year ends in September). The company also sports over a 50% net income margin and spits off an incredible amount of free cash flow due its capital-light business model. Over the last 3 years Visa has generated $30B in FCF and has distributed 90% of this cash as dividends or utilized it to buy back shares.
While the Visa brand is one of the most recognized in the world, very few consumers know how they actually make money. Let’s stop by each of the three money-growing redwoods in the forest.
Money Grows on These Trees
The first stop on our tour is the Service Fees grove. In order to take part in the Visa network, banks pay a small fee per transaction. The revenue of this segment is directly tied to the total amount of dollars that flow over the Visa network. Let’s proffer payment volume increases 10% in a year, service fee revenues are going to grow pretty close to 10% as well.
Of the $8.8 trillion in total payments volume that flowed over the Visa network in 2020, the company captured $9.8 billion as revenue. This is where the aforementioned 0.11% (the “service yield”) of each transaction comes from: $9.8b/$8.8T= ~0.11%.
Visa generated $5.5B in service revenues in the first half of 2021 (up 7% from the same period in 2020).
Service Fees have grown at a 10.8% CAGR since 2010 and should come in at $11.5B for the year end 2021 as economic activity continues to rebound.
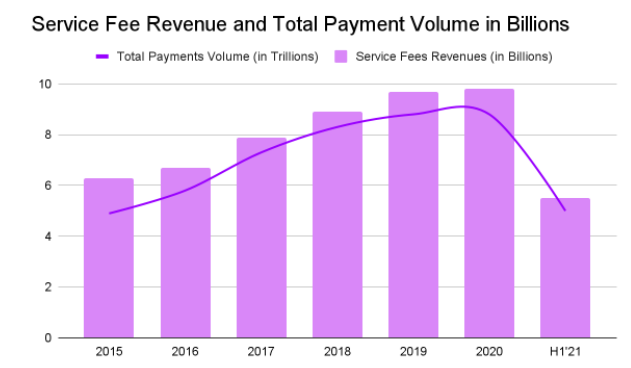
The steady, predictable growth in this segment is attributable to the long enduring transformation from cash to digital. Visa’s service yield has continuously climbed and highlights the payment network’s economies of scale. As total payments volume has increased from $7.3T in 2017 to $8.8T in 2020 the service yield has also increased from 0.1092% to 0.1114% highlighting the segment’s operating leverage.

While seemingly inconsequential this increase in service yield captures an additional $22 in revenue for every $10,000 transferred on Visa’s network. That adds up quickly when the company processes $8.8T! Who ever said tenths of a percent doesn’t make a difference?
It is reasonable to expect the ~11% growth in Service Fees to continue at this steady pace in the coming decade for a few reasons:
- First, we live in a consumer-oriented society where people spend more and more every year. Visa is a royalty on economic activity which is bound to increase over time.
- Second, there is steady inflation. As the costs of goods and services increase Visa’s revenue will scale with the incremental costs.
- Visa is working from a somewhat depressed total payments volume base in 2020 due to the pandemic. This will juice the eventual 2030 CAGR number as it has a soft starting year.
- 19% of all consumer spending is still done in cash which leaves a lot of growth left to capture. Cash spending is down 7% from 2019, exemplifying the pandemics acceleration of the shift to digital.
- Some bears claim that the sudden drawdown in cash usage over the pandemic will be transitory and that these cohorts revert once health concerns subside. I agree that cash spending may rise slightly next year, digital payment has proven to be a very sticky service. I believe an outsized portion of the new volume will stay and cash as a payment source will continue to trend downward
- Lastly, I believe the service fees revenue (growth which is ultimately driven by total dollar flows over the network) will get a substantial boost and continue compounding at ~11% per annum because of new flows. Visa has begun focusing on B2B, b2B P2P, G2C, and G2G. Larger organizations are slower to adopt new technological changes and the time seems right for them to transition.
Visa estimated in their 2020 annual report that these new flows open up a $185T opportunity. TAM projections are inherently rosy and I am cautious to forecast Visa being a prominent player in person to person transactions.
I believe Visa will capture a portion of small business to business (“b2B”) and business to business (“B2B”) flows. The large majority of these transactions are done through checks which frankly is clunky, wastes time and creates unnecessary payments like stamps and envelopes (so 1900s!).
All in all this redwood still has a lot of sunlight to capture and will continue to grow at around 11% per annum for the foreseeable future. In addition to the payments volume growth, increased operating leverage from economies of scale will increase the service fee yield. As dollar volume on the network increases Visa’s revenues will scale accordingly.
Modeling out a 0.12% service fee yield on $14.8T in payments volume in 2025 (11% CAGR from 2020 level) we come up with $17.8 B in Service Fees revenue for 2025.
If I had Nickel for Every Other Time…
Someone in the world processed a payment digitally in 2020, I would have about 140B nickels. That’s the second redwood- a toll booth. Data Processing Fees are a flat fee per transaction for transferring funds between banks. In FY20 on transaction volume (total payments processed) of 140 billion Visa generated $10.9 billion in revenue or about $0.078 per transaction.
Transactions processed on Visa’s network have steadily grown 12% per annum from 71 billion transactions in 2015 to over 140 billion in 2020. Data processing fees have followed in lock step growing at a commensurate rate over the same period from $5.5B in 2015 to $11B in 2020.
")

Notably, Visa’s cut of each transaction (measured by Data Processing Revenues/Transactions Processed) has increased each since 2017 as shown in the table below.

The double edge blade of total number of transactions on Visa’s network increasing coupled with higher fees per transaction bodes well for the Data and Processing segment.
It takes no stretch of the imagination to forecast continuation of the 12% per annum growth in this segment for next 5 years. Simply taking the 2.75% per annum growth in fee per transaction since 2017 and 7.5% per annum growth in transaction volume through 2019 (disregarding 2020 because of COVID outlier) we can forecast 2025 data processing revenues to be in the range of $18B.
As of March 31st Visa had already processed 76.8B payments and are on pace for a 9.5% increase from 2020. Of course, comps will be incredibly easy for the company heading into the second half of 2021 so it is prudent to index these results to 2019 instead.
Since June of 2020 Visa has been releasing monthly 8Ks disclosing important KPIs for investors to track how the business (and economic activity as a whole) is recovering from the pandemic.
U.S. payments are up 31% compared to 2019 and payment transactions are up almost 24% from 2019 highlighting the business model’s resilience and the willingness of consumers to spend.
It takes no rocket scientist to forecast that Visa’s revenues would be up from 2020 as the world reopened, but the snap back to the growth trend has been incredible.
Data Processing Revenues should come in around $12.8B for 2021 taking into account the 20% increase in processed transactions relative to 2020.
This redwood still has room to grow as well: the majority of cash transactions are small, $25 or less. Cash market share was already trending down prior to the pandemic, however tap-to-pay has accelerated Visa’s market share in small-transaction payments as it is much more convenient than cash (no fumbling with change, getting the wrong amount back, etc).

I would be surprised if cash returns to 7-8 of the 18 pre-pandemic monthly payments under $25. While I think the pandemic is the catalyst for the significant drop and I see cash payments creeping back up to maybe 5 or 6 I believe the introduction of tap-to-pay and shift to digital will allow Visa to retain an outsized portion of the payments they captured over the pandemic.
“There should be a place where only the things you want to happen, happen.”– Max, Where the Wild Things Are
The Cross Border Fees segment couldn’t agree more with you, Max. This relatively “little guy” got trampled in the pandemic, but has promising growth prospects. It is easily the highest yielding revenue stream at about 1% of each transaction. A cross border transaction is registered when a payment takes place between two parties whose banks are in different countries. When I go to my dream vacation in the south of France and swipe my Visa card I am initiating a cross border transaction.
From FY18 to 19 international transaction revenues grew 8%, but have been kneecapped by the pandemic getting chopped 20% in 2020 to $6.3B. Thus far in Visa FY21 there hasn’t been much recovery in this segment only doing $2.9B through the first half.
This segment, obviously, has been decimated by COVID as travel came to a halting stop. However, I have started to see some revibrance since the Spring.
In monthly 8Ks since June of 2020 Visa has disclosed numerous KPIs of their various segments including cross border.
Cross border volume growth on a constant dollar basis is 30% higher than it was in May of 2020. The open cross border corridors are extremely promising as, “US to Mexico volume was almost 20% above 2019 levels for the quarter.” According the Q2 earnings call. This indicates a strong resurgence in cross border transactions and highlights the segment’s resiliency.
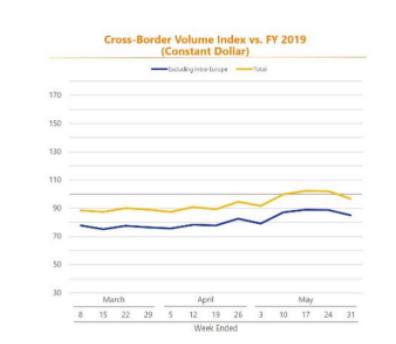
Cross border volume was still down 5% from 2019 levels. Throughout March, April and May of 2021 we have seen international volume steadily come back online which is encouraging. I expect Visa to report that this segment including intra-EU is back to 2019 levels in the Q3 report.
Travel, of course, is struggling at only 50% of 2019 levels. This cohort of cross border volume has mounted a strong resurgence since the middle of April increasing 10% in just over a month. Due to the holiday season and increased vaccination rates I expect card present and card not present travel volume to be 70% recovered by the end of 2021.
Driving this recovery were two factors Visa’s CEO Al Kelly said in the company’s second quarter earnings call, “First, those who are abroad are spending more, likely because of fewer restrictions. This quarter, essentially all of the cross-border travel spend improvement was driven by higher spend per card rather than more active cards. Second, we continue to see strength from countries with open borders. For example, US to Mexico volume was almost 20% above 2019 levels for the quarter.”
Visa’s CFO Vasant Prabhu highlighted in the Q2 earnings call that U.S. to Latin America spending was nearly 90% of 2019 levels and the most depressed comps cross border travel to and from Asian countries down 75% from 2019.
International revenues should come in at $6.5B for FY21, up 40% from 2020 but still down 20% from 2019.
In short, while still lagging compared to 2019 levels the international revenues stream (Visa’s highest yielding segment) is making a strong recovery and we should see the company blow through 2019 levels as travel spending (only 50% of 2019 level) comes back online. This is aided by increased adoption of card not present transactions (generally ecommerce) which is up 60% from 2019 levels excluding travel.
Due to secular tailwinds in ecommerce growth (projected to grow at 14% CAGR through 2025) and the recovery of travel I can easily see this segment growing at 12% per annum for the next five years to $11.1B from this depressed base.
Of course, after admiring any wonderful spectacle of nature, one must wonder…
What Lumberjacks are Going to Cut Down These Trees?
“It’s almost as if the model for both of these companies [Visa and MasterCard] is like if you were an evil genius designing like a perfect competitive moat, you might design something like this”–Patrick O’Shaughnessy, Business Breakdowns
The skeptical reader will question how I can make all of these claims about clarity and visibility about future growth. If this business is so attractive, why haven’t competitors tried to cut down the forest?
Visa’s moat comes from its deeply entrenched position in the payments world. The business started in 1958 as the BankAmericard credit card program in California. Bank of America shipped 60,000 credit cards to the residents of Fresno (about half of them were banked by Bank of America in the 50s) and the bank extended credit to the consumers. The idea spread like wildfire. Merchants loved it because it enabled them to capture more payments and consumers loved it because they viewed it as free money.
Extending credit to consumers who had no idea what they had gotten themselves into was (and still is) a decidedly bad idea. However, the seed had been planted and the network effect began to germinate.
Eventually, other banks took notice and followed suit doing card drops all over the country. As you can imagine this got out of control fast, people had a dozen or so cards with some being taken here and others there. From this mish mash of cards two consortiums that acted as routers that connected the issuing banks to the acquiring banks: Visa and MasterCharge (now MasterCard).
This multi-bank consortium set-up immediately established an insurmountable barrier to entry. The banks were unlikely to switch off the payments processor they all controlled.
The decades of incubated, unchallenged growth from the mid 70s until they went public in the late 2000s allowed these businesses to mature their network effects. Everyone uses Visa or MasterCard because every other merchant and consumer uses Visa and MasterCard.
Visa’s virtuous cycle is that as more cardholders spend more money on Visa cards, more merchants will accept Visa in order to capture the sales. As more merchants join the network, consumers are more likely to get a Visa Card. A classic network effect.
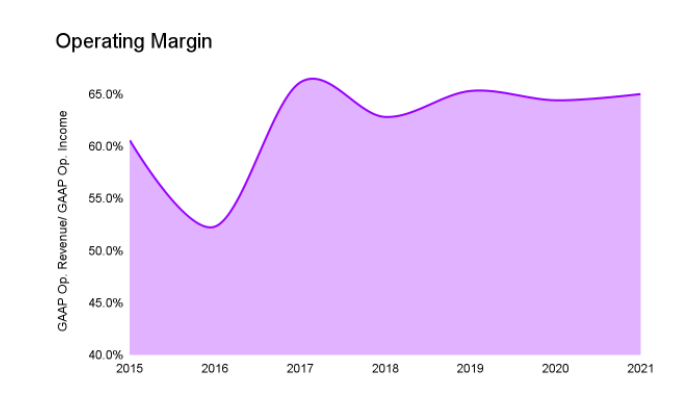
Visa also exhibits scale economies. While there is a large upfront cost in the computers, data centers, and marketing these costs don’t scale as transactions increase. This has allowed the business to increase its operating margin from 60.6% in 2014 to 65% as of Q2’21. Also the cost per transaction (network and processing expenses/payments processed) has steadily declined since 2015 as total transactions have increased.

Many of the potential competitors have chosen to instead partner with Visa or MasterCard because of the high barrier to entry in initial capital expenditures.
As Mine Safety wrote,
“Any would-be competitor would have to invest billions of dollars in networking infrastructure so that transactions can be processed in real-time and with practically zero failures. They would need to establish relationships—one by one—with 16,000 banks worldwide. They’d need to write complex software that works with each of those banks, as well as millions of payment terminals. And they would need to ensure compliance with thousands of financial laws and regulations from over 200 countries.”
It makes sense that both Square and Paypal (probably the two biggest threats to the businesses when they first started) have decided to simply partner with Visa.
Apple and Google’s payment features lack the scale that Visa and MasterCard have with merchants. Therefore they have less developed network effects and enjoy less benefit from economies of scales.
American Express’s closed loop network (meaning Amex can only process a payment if it is also on the other side) and surcharges reduce their scale.
In truth, the biggest threats to this business over time are geopolitical risk and fragmentation. Of course, management has to constantly be paranoid and look over their shoulders at new fintech startups, Square, PayPal, and Stripe to make sure these companies don’t sneak up on them or beat them around a turn (like they did in P2P, this is why we are seeing Visa jump on B2B so hard), but the long term threats to Visa’s business are really things out of their control.
For now management can keep their eyes on the horizon, looking for new flows and buying interesting fintech companies.
Competitive Landscape
A quick, definite over-simplification of the unit economics of a transaction are apt here. I am a big Smoothie King guy so let’s use that as our example.
When I order my go-to Caribbean Way smoothie (smoothie cognoscetis are nodding in agreement) Smoothie King takes ~97% of the transaction. The remaining 3% is divided up amongst the issuing bank (consumer’s bank), the acquiring bank (the merchant’s bank), and the payments network. I want to point out that there is a 24 page PDF on the Visa website that explains all the various interchange rates so this is a very rudimentary explanation.
The vast majority of that 3% goes to the issuing bank and as mentioned Visa captures about $0.078+ ~0.11% of the overall transaction.
What the payment networks really compete over here are the issuing banks. The acquiring banks have no choice, they have to accept both Visa and MasterCard so they can capture all of the possible revenue for their merchant’s. It would be completely nonsensical for Smoothie King’s bank to say, “I am only going to accept MasterCard and not Visa” as they would be sacrificing meaningful revenue.
This creates a really interesting model where rates rise over time. That seems backward at first glance. In an oligopolistic industry you would expect rates to fall. However, because the issuing banks’ economics come from that 3% of the transaction they get Visa and MasterCard are incentivized, in order to lure issuing banks away from the other payment network into theirs, to grab for a higher rate. This means the way for the payment networks to acquire more “customers” (issuing banks that is) is by increasing the interchange rate.
This is the chink in Visa and MasterCard’s armor. They don’t control the consumer. The issuing banks do. Payment networks have to tread lightly around the issuing banks. If they get on the issuing bank’s wrong side the bank will simply switch to the competitor.
Essentially Visa and MasterCard compete for these issuing banks. Merchants obviously hate this. To lure in issuing banks, V and MA will offer various card incentives like cash back to issuing banks’ consumers. To stick with Smoothie King, pretend Visa lifts the interchange rate from 3% to 3.5% with a new card. Smoothie King would hate that because it would mean they are losing out on more revenue.
The issuing banks, on the other hand, love it. They can now offer their consumers higher card incentives and attract new customers. Maybe instead of 2% cash back they now offer 2.5% cash back at all Smoothie Kings.
Cash Return to Shareholders
As Visa continues to increase transaction volume, operating margin should climb as well. This is the quintessential economies of scale business: as volume increases per unit costs decreases. We see this in the operating leverage as more payments are processed. Cost per transaction, as we saw earlier, has dropped ~25% in 5 years.
Due to the increased operating leverage from higher transaction volume, cash return to shareholders in the form of increased dividends and share buybacks should increase in the future as a higher percentage of Visa’s topline will drop down as free cash flow.
This is a very capital-light business model that requires very little cap ex. The largest expenses in the business by far are personnel and card incentives. In reality it would probably only take a dozen or so people to keep the lights on at Visa, but the need to continually innovate and the lack of expenses elsewhere allows the company to heavily invest in its employees. The chart below shows cap ex as a percentage of revenue since 2015.

Unlike many businesses, Visa’s expenses don’t show up in CapEx. The way Visa reinvests in their business is through hiring talent, buying fintechs such as Tink and CurrencyCloud and pushing out new incentives.
Client incentives have been 20% of revenues since 2015, but have recently increased to 25% as of H1‘21. I think over the next decade client incentives may drift upwards to 21-22% of total revenues as Visa and MasterCard try to “outbid” each other for new customers.
So what has Visa done with all this excess cash that they can’t reinvest? Simply returned it to shareholders. Of the aggregate $72B in cash from operations generated since 2012, Visa has returned an enormous $64B back to shareholders in the form of repurchases and dividends. Nearly 20% of shares have been retired since 2011 and since 2013 Visa has raised their quarterly dividend from 8c per share to 32c per share. Combined that’s an incredible 88% of cash generated from operations returned to shareholders.
With the limited retained earnings, Visa has been able to generate ever higher net income. This business needs little, if any, capital to grow and shareholders have been rewarded.

Leadership
If I haven’t harped on it enough already: Visa is probably the easiest business to run in the world. I could step up to the CEO position today, vacation to Capri for the next decade and Visa would probably grow earnings in the high single digits.
With that being said CEO and Chairman Al Kelly and CFO Vasant Prabhu are terrific managers. They diligently watch the fintech horizon, continually widen Visa moat and remain laser focused on returning cash to shareholders. Mr. Kelly and Mr. Prabhu have been in their current roles since 2016 and 2019 respectively.
Visa is conservatively financed with about a 2:1 current ratio and total debt less than current assets.
Management allocates capital well earning 16% on capital and return on capital employed of nearly 23% in 2020. Return on tangible assets is in the mid 60% range. I think this the inverse case of Buffett’s famous line, “When a good management team meets a terrible industry, it is likely the reputation of the industry that remains intact.” Any management team could step into Visa today and earn satisfactory returns on capital and efficiency ratings.
When contrasting Visa’s results against MA, Visa’s team falls short. Mastercard’s return on capital in 2020 was 25% and ROCE was 38%. Some of this difference is due to MasterCard being more aggressively financed and slightly smaller.
Valuation and Outlook
All KPIs point to a strong recovery in Visa’s core businesses. Processed transactions are up 45% from Q2 of last year through May 31st and payments volume is up nearly 50%. The recovery from depressed economic activity due to Covid is going well. These KPIs are directly tied to the Service and Data and Processing Revenues– Visa’s largest revenues streams.
Looking through the end of the year the company should be back to its growth trajectory through the second half of this year as borders open up, restrictions are loosened and vaccinations increase.
I believe projecting payment volume to grow 11% through 2025 (only up .2% from the 10 year CAGR) because of new flows and some inflation is reasonable. Data processing revenues should track the increase in transaction volume so keeping that at the historical 10 year average makes sense despite the on-boarding on new flows. Call it 12% per year. Finally, I believe that through 2025 we could see international revenues grow at 12% per annum due to the depressed 2020 base Visa is working from and with the additional tailwind of 14% CAGR in global ecommerce.
Assuming a 25x exit multiple, an operating margin of 65% and a 10% reduction in shares outstanding we would get a 5.5% compounded return through 2025.
In order to achieve a 10% return, with these assumptions, Visa would have to drop to $206 per share.
This is Mine Safety Disclosure’s model below. He does fantastic work. If you want to input your own assumptions, the model is here.

To be very back of the envelope here we can project Visa’s total earnings growing anywhere between 10-13% CAGR over the next five years from the $10.8B 2020 base. At the low end of the range Visa’s earnings are ~$17.5B and on the high end they are $20B. At today’s 49 P/E the current market cap is $530B. Modeling an exit multiple of 35x (let’s be aggressive) our return would range somewhere between 3% and 6% per year. Hardly exciting.
I realize this does not take into account share buybacks, I just want to provide a framework for how to think about returns from such a high valuation. As Chris Bloomstran says, “Price matters.”
Conclusion
Visa is one of the most attractive business models available in the public markets. They are a simple predictable, free cash generative dominant player in a high barrier to entry industry. They are well capitalized with a strong balance sheet, earn high returns on capital and are led by able and honest shareholder-oriented managers. They are backed by a compelling secular growth story post pandemic as the shift away from paper payment accelerated.Whether this is manifested in BNPL, credit, or debit Visa will benefit.
The company earns high returns on capital and has very little capital expenditures. I suspect earnings to grow in the range of 10-13% over the next 10 years. The wide moat the company has developed through its dual sided network effect and economies of scale make it perhaps the most defensible business model available in public markets today.
At a market cap north of $550B, I would not consider buying the whole company. So why even buy a piece? My expected rate of return of 5.5% from this level does not pass my 10% hurdle rate. I am waiting for Visa to drop into the low $200s before I consider buying. Until then I will consistently stay up-to-date on how the business is progressing and the competitive landscape and continually update my models.
Over time a royalty on economic activity is a great business. Payments volume will increase, both the service fee yield and fee per transaction will trend upwards, and cost per transaction will continue its downward march.
“The best business is a royalty on the growth of others, requiring little capital itself.” – Warren Buffett
Thank you for reading, it means the world to me.
Disclosure
I do not, as of 7/26/21, own any shares of $V, $MA, $AXP, $DFS, or $PYPL. I own shares of $SQ. I am not a financial advisor. These articles are for educational purposes only. Investing of any kind involves risk. Your investments are solely your responsibility and we do not provide personalized investment advice. It is crucial that you conduct your own research. I am merely sharing my opinion with no guarantee of gains or losses on investments. Please consult your financial or tax professional prior to making an investment.
Bibliography
Visa Q2 2021 Financial Results
Visa Q2 Earnings Call Transcript
2021 Findings from the Diary of Consumer Payment Choice