Author: Ben Tewey
Price: $20.40; 2025 Price Target: $42 (23.5% IRR)
Callaway: A Corporate Makeover
Overview
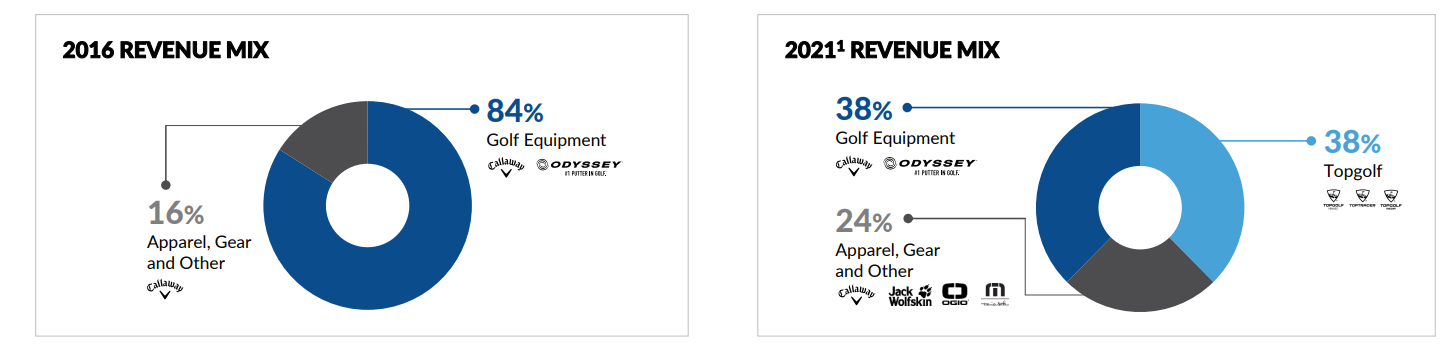
Callaway Golf ($ELY) is a $3.7bn market cap, $6.2bn EV company is perceived as an over-earning manufacturer of golf clubs, balls, and soft goods facing a slow growth end-market staring down a recession. However, since 2016, they have diversified and completely pivoted the business through a series of acquisitions and mergers taking golf equipment down from 84% of revenues in 2016 to today just 38% in 2021.
In March of 2021, ELY acquired all of Topgolf in March 2021 for $2.5B. The TopGolf merger has transformed Callaway into the leader in eatertainment and off course golf industry. They operate 3 reportable segments: Topgolf (which includes the Toptracer hidden gem), Golf Equipment which sells golf clubs and balls and Apparel, Gear and Other which houses the burgeoning TravisMathew brand, OGIO and jack Wolfskin as well as Callaway soft goods (hats, gloves, bags etc).
Callaway did ~$3.1B in revenue in 2021 on 6.5% operating margins. This year they are on pace to grow 20% on the back of a sticky (and affluent) golf consumer. Margins will be flat to slightly up as a result of price taking in the Topgolf segment
Thesis
Callaway currently trades at $20.50 a share ($3.7B market cap $6.2B EV). The company is perceived as an over earning manufacturer of legacy golf equipment – a difficult industry with highly variable costs heading into a recession. In reality Callaway has a long runway for growth in its newly acquired Topgolf segment which has phenomenal unit economics with 40% cash on cash returns, 32% EBITDAR margins, and a long runway for new venue builds (70 units today with potential for 400+). During the Topgolf merger, Callaway also picked up the Toptracer business, a ball tracking technology that can be installed in driving ranges to increase revenue 20-60% for customers with 75% EBITDA margins and no ongoing capital needs.
I believe there are a few catalysts at play. As the superior TopGolf and TopTracer business make up a more meaningful percentage of sales going forward they will be margin accretive and the stock will be forced to re-rate. Topgolf has never traded publicly and analysts are still trying to figure the business out. This should abate as the company recently went on a none event road show to JPM and B of A to initiate analyst coverage. The market does not fully appreciate Topgolf’s unit economics and competitive moat. The hidden gem, TopTracer, is especially underappreciated.
Propelled by 25%+ ROIIC, mid teens operating margins by 2025 with 20%+ revenue growth fueled by 4-5% SVS CAGR and 11 new store openings per year in Topgolf, ELY will produce $2.00 per share in FCF by 2025, at a 5% FCF yield (fair for a business growing topline LDD and EBIT in the mid teens) IRR is 22%.
Business Segments
TopGolf
The TopGolf segment is made up of three businesses: Topgolf Venues, TopTracer and the WGT video game. The business generated over $1.2B in revenues in 2021 with well over 95% of revenues from Topgolf venues. Callaway, which owned 14% of Topgolf prior to the merger and had CEO Chip Brewer sit on the board since 2012, acquired the business in its entirety in March 2021 for $2.6B from various PE players.
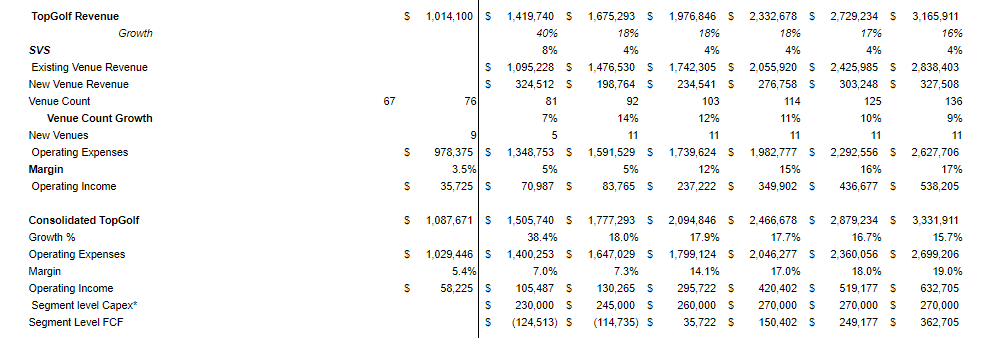
Topgolf is on pace to double its U.S. venue count since 2017 from 40 to 81 by year end 2022 (15% CAGR), same venues sales (SVS) were up 6% over 2019 levels and the segment posted low teens EBITDA margins in 2021 on $1.2B in revenue.
Topgolf was founded in the UK in 2000 by the Joliffe brothers and expanded to the U.S. in 2005. The business is a modern driving range with a social, gamified experience serving food and beverages. The venues, through RFID golf balls and varying targets sparsed over the 300-yard outfield, enable a video game-like experience with live scoring. Topgolf also has a strong business in events such as charity fundraisers or corporate outings. The business does have some seasonal aspect to it as the venues are open air which reduces visits in the colder months.
Callaway first invested $10mm in TopGolf in 2006, and followed on in subsequent rounds, investing $75M in total for a 14% stake of the company. In October 2020, Callaway doubled their shares outstanding to 180M and issued the new half to TopGolf’s PE investors to merge the companies. Callaway shareholders owned 51% of the new entity and TopGolf PE’s owners (Providence Equity, WestRiver Group and a few others) owned the minority stake.
Today, Topgolf has 76 units (72 in the U.S. and 4 franchised internationally), management has guided to building 10-11 new venues per year and estimates a total TAM of 450+ venues in the U.S. Internationally, management cites an opportunity for 250 units at $1.1mm of annual 85%+ royalty revenue each implying a 5-6% top line royalty. This is still a long way off with only 2 international venues opening this year, 22 in total by 2025 with 8 new openings annually thereafter.
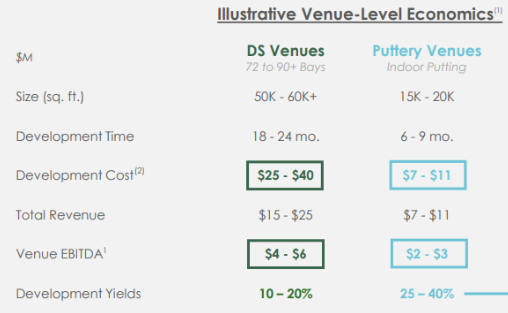
Venues come in 3 formats: small (6 locations), medium (15 locations) and large (55 locations). Small venues target populations of 250k-600k, have 30-60 bays and cost $15M-$20M to build. Two examples are in Augusta, GA and Chattanooga, TN. Medium venues are targeted at populations of 600k-1M (think Baton Rouge or Fort Myers), have 70-100 bays and cost $20-35mm to develop. Large venues are built for populations greater than 1M (Edison, NJ and El Segundo, CA) have over 100 bays and three floors and cost $35M-$60M to build. These are behemoths. They are generally 20K-100K square feet and are built on 7-15 acres.
Construction takes 12 months on average, with smaller venues being completed faster, costing $10-40M. Topgolf lays out only $7.5M (25%) of the cost to build in cash while a landlord finances the rest. 80% of properties are leased. The average venue generates ~$17mm of revenue, $5.5M of EBITDAR less $1.9mm of rent, for $3.7mm of cash EBITDA for 50% cash on cash return for venues. It is important to note that this number is excluding maintenance capex which at 700K a year would bring cash return down to 40%, still phenomenal ROICs.
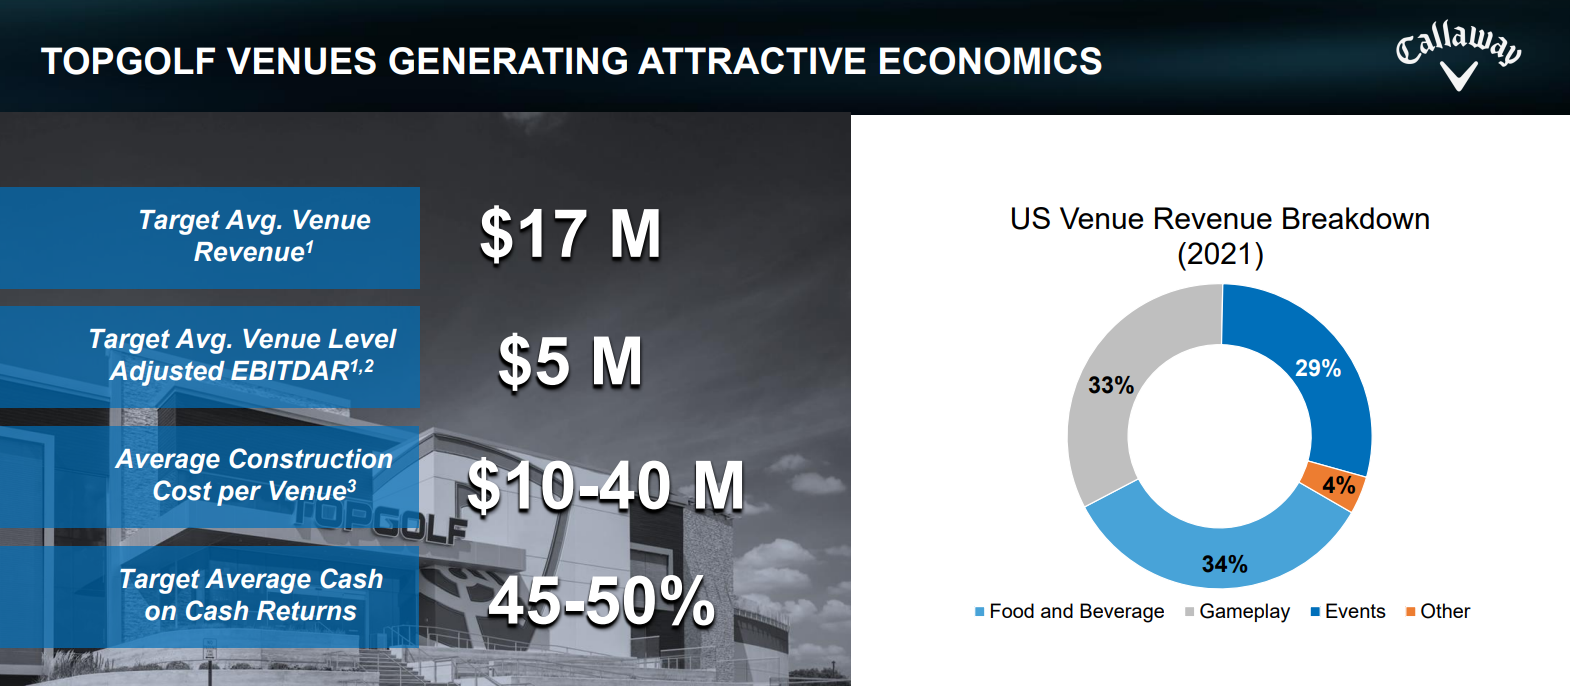
The demographics that visit topgolf are also exciting and bode well for brand growth. The average group of 4 spends $15-$20 each to play (the driving range itself has 80%+ gross margins) and $20+ on food and beverages over 2 hours for an average spend per guest of $36. Of Topgolfs 30M visitors in 2021, 50% were female, 50% identified as non-golfers, and 60% were ages 18-34 demonstrating that Topgolf is engaging new demographics (women and young players) who are not traditionally interested in golf with high LTVs. This creates a tremendous opportunity to develop the Callaway ecosystem as Topgolf, a natural on-ramp for new golfers, dominates 85% of the off-course golf industry which should benefit the equipment business as these players try on course golf (75% of non golfers dais they were interested in on course after playing at Topgolf).
In addition to the new venue builds on the way, Topgolf has plenty of low hanging fruit for efficiency gains such as upgrading the reservation system, bay utilization, digital ordering and pay in bay, multiple bay bookings to accommodate crowds larger than 6 and dynamic pricing.
At this stage, only 66M people in the U.S.(20% of the population) are within a 25 minute drive of a Topgolf, by end of year 2023, the company is projecting that this number will rise to 88M with new builds in Baltimore, Raleigh-Durham, Louisville and Seattle coming online this year.
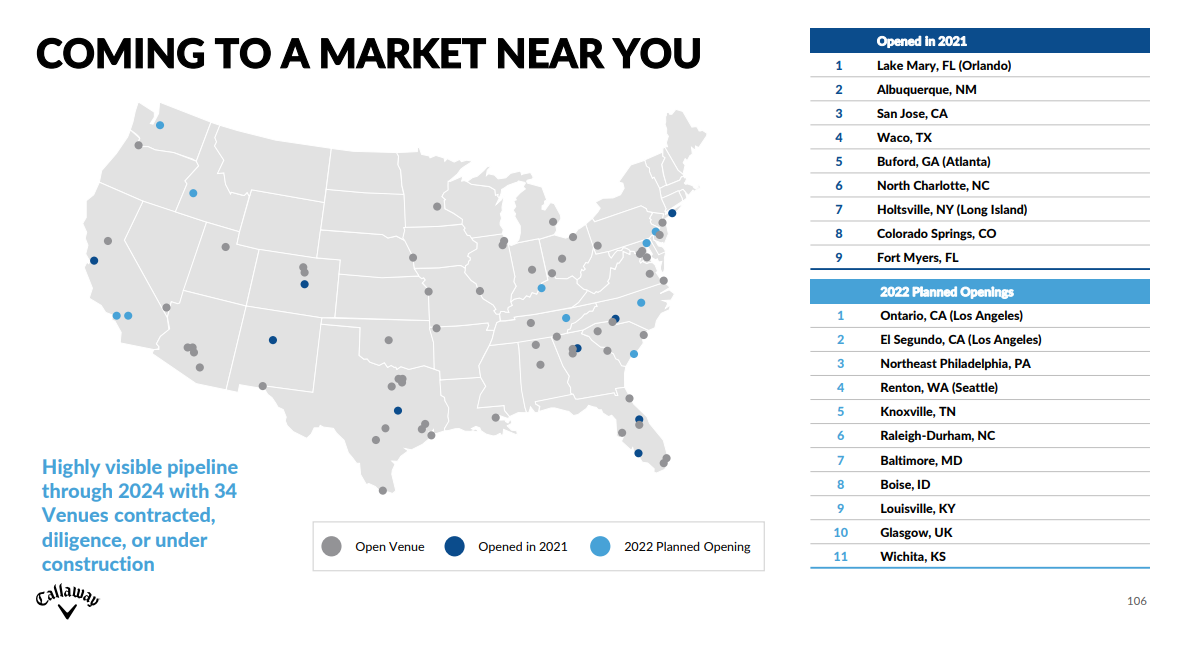
At the recent Investor Day in May, Callaway guided to $2.2B in venue revenue and $400m+ in EBITDA in 2025 driven by low single digit SVS growth, 33 new venue builds (bringing the total to 114) and 22 franchised venues internationally. In 2022, Topgolf should be able to do north of $220M in EBITDA on $1.5B in revenue (14.7% EBITDA margin) driven by mid single digit SVS sales over 2019 levels. This segment is capital intensive as management reinvests all of segment EBITDA back into capex to build new venues. The ~$230M in segment capex ELY will show in 2022 is slightly elevated because of timing of certain expenses because of new builds and ongoing capex should average ~$185M thereafter. This business should average Management also expects Topgolf to be self funding by the end of this year and cash generating in 2024.
The venues are a phenomenal business at maturity that will require maintenance capex of only about 5% of revenues under my previous assumption of $700k maintenance capex on $15M of venue revenue (assuming average venue revenue takes a slight haircut as they open more smaller locations). Gameplay gross margins are well north of 70%, beverage margins are fantastic. The primary costs at the unit level are rent ($1.9M) and labor.
TopTracer
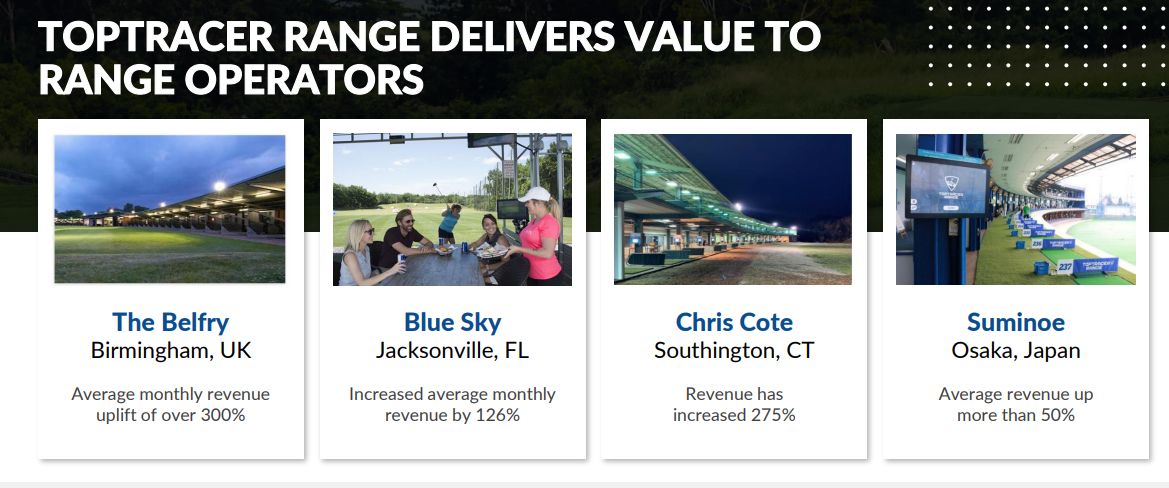
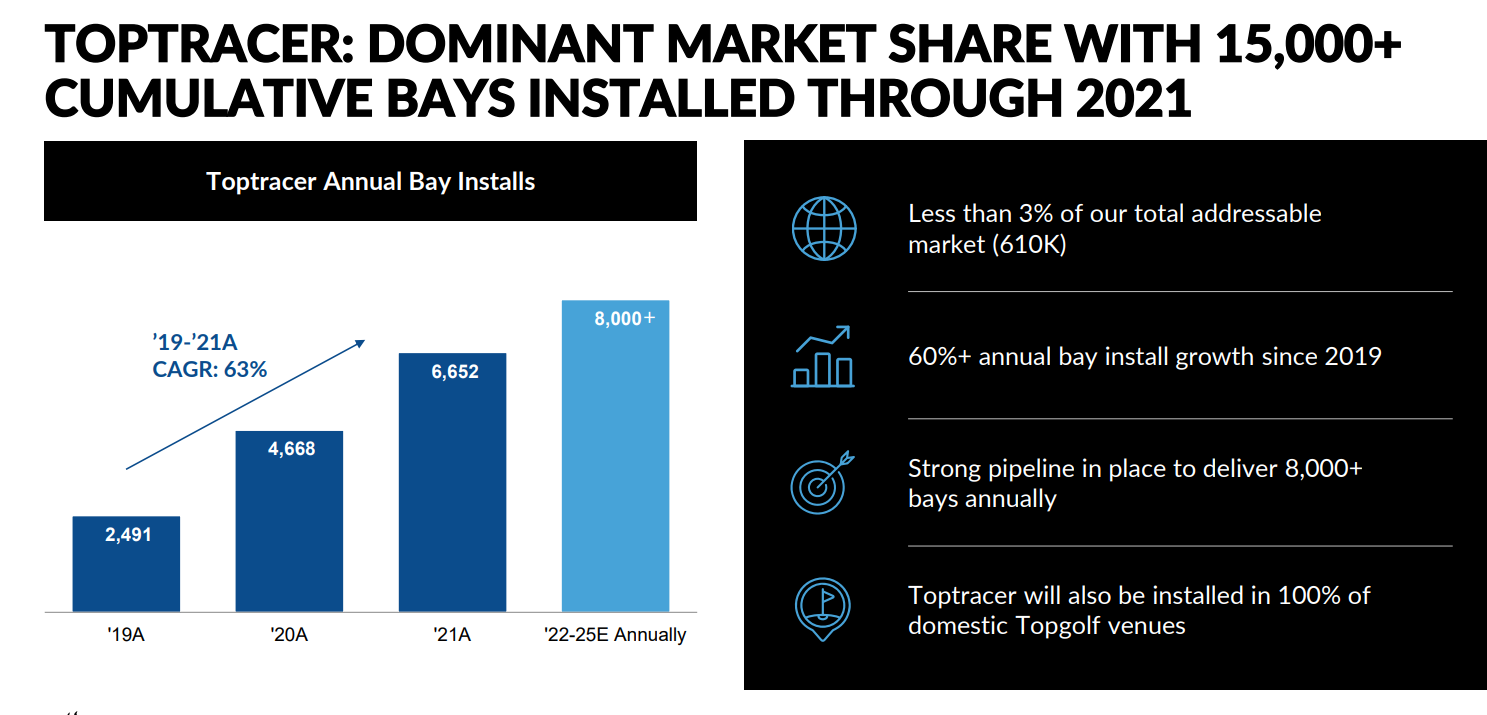
As Chip Brewer stated on the Topgolf merger call, “I would argue that this [TopTracer] is the hidden gem within our business. Golfers are familiar with this technology from watching televised professional golf tournaments, but it is also a technology that we are using to transform driving ranges around the world. It is a capital-light, high-margin business model, and it is growing in the triple digits.” Topgolf licenses TopTracer’s ball-tracking technology, to independent driving ranges and for use in golf broadcasts. TopTracer’s camera and screen system tracks all ball flight paths across an entire field of vision, and real-time shot analytics, such as ball speed, apex, curve, distance, spin etc.
TopTracer is installed in over 16,000 bays worldwide and enables the gamified experience at Topgolf by enabling instant shot replays and tracking for the games but also provides a significant value proposition for installation at traditional driving ranges. Driving ranges that installed TopTracer have reported a 20-60% revenue uplift turning a historical loss leader into a profitable segment for courses.
TopTracer’s ball tracing technology has transformed televised golf and has dominant consumer mindshare as it has been featured in over 140 televised golf tournaments. If you’ve ever watched a golf tournament you’ll recognize TopTracer as the technology that enables viewers to see the red line tracing ball trajectory after a player’s drive.
TopTracer, which is installed in all domestic Topgolf venues, has scaled from 0 to 16,000 bays in just a couple years. About 8,000 of these bays are non-Topgolf and annual bay installs have grown at a 63% CAGR since 2019 from 2,491 to 6,652 installs per year.
TopTracer unit economics are terrific. They charge $2,000 per year per bay which produces 75% EBITDA margins or $1,500 per year of recurring cash EBITDA. Once these are installed there is no incremental capital needs, everything drops to the bottom line beside some maintenance software updates which are de minimis and driving ranges aren’t going to remove them once they are installed.
Typical contracts are signed for 3-5 years. Management has stated they intend to add 8,000 new bays per year through 2025. In a TAM of 610,000 total bays, they currently have a 3% market share. Moving to 40k bays by 2025 would imply a 5% market share and is hardly a heroic assumption. In turn this segment, a small portion of revenue and EBITDA today, would provide $60M of EBITDA in 2025 with a long runway to go. At 25% market share TopTracer would produce ~$230M in EBITDA.
Down the road there is some interesting optionality that TopTracer enables. Players could play against each other virtually, for example TopTracer hosted a “9-shot challenge” through their video game business World Golf Tour (WGT) with participants across 18 countries. Management has also discussed the opportunity to sell advertising and partnerships onto the screens TopGolf and TopTracer has set up. This is very highly targeted advertising for sporting goods stores such as Dick’s and Hibbett, but also Nike or Under Armor are natural buyers.
Lastly, the data aspect of this business is underappreciated. Toptracer has already captured data on 2 billion balls hit using their technology. The engaged or avid golfer, much less an amateur or pro playing in tournaments, would be willing to pay up for the treasure trove of data Toptracer unlocks which would help them improve their game by giving them data backed reasons for why they’re hitting it short right.
There is slight seasonality to TopTracer bay installs due to the fact that it’s easier to shut down a range and install the hardware necessary for TopTracer in the off season (winter). TopTracer contributed $43mn in revenue in 2021 with a clear line of sight to $80M+ in revenue by 2025 still growing 20%+.
My base case TopGolf segment model is built on high teens operating margins by 2027 with 20%+ revenue growth fueled by 4-5% SVS CAGR and 11 new store openings per year.
Apparel and Gear
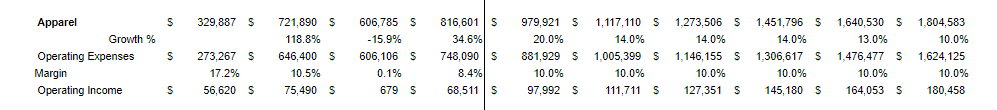
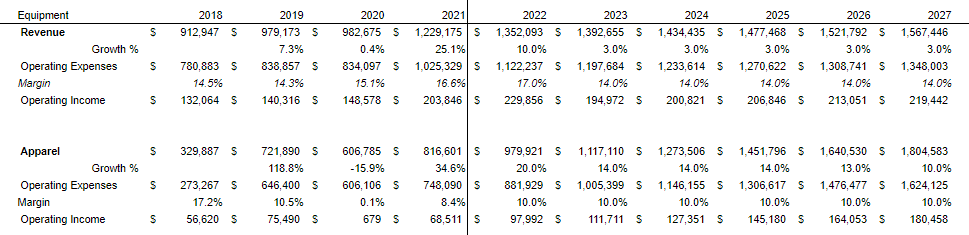
In addition to Callaway’s soft good golf business (gloves, hats, shirt, bags etc), they have recently acquired a robust set of apparel brands since 201 7 including TravisMatthew, OGIO and Jack Wolfskin. These brands, while still upscale, are less reliant on the golf consumer and appeal to a broader set of lifestyle consumers. This segment did $816.6M in revenue in 2021 (26% of revenue), grew 34.6% year over year and 8% operating margins.
TravisMathew is by far the most exciting brand in this segment. They sell shirts, shorts, hats, belts, sunglasses and socks. In 2017, TravisMathew had net sales of $61M and posted $7M in EBITDA (11.5% margin). This year management expects the brand to produce $300M in net sales with 16.7% EBITDA margins or $50M in EBITDA and have laid out a path to $500M in sales in 2025. Assuming they achieve their 2022 target, this would indicate a 38% CAGR in sales and 48% EBITDA CAGR.
Callaway operates 31 TravisMathew stores, although the majority of sales is derived from wholesale. These stores have sub-2 year payback periods and Callaway plans to open 10 new stores in 2022 and 5 annually thereafter. Last quarter, SSS comped at +50%. For a business now doing $50mm in EBITDA growing 20% a year with room for further operating leverage according to management, a $125M price tag seems like a steal.
TravisMathew recently launched a women’s brand. Women’s is currently the fastest growing segment of the market and this should prove to be a nice growth lever going forward. Don’t get it twisted however, apparel is a brutal business that is plagued with average margins and trendy consumer taste.
Jack Wolfskin (acquired in 2019) is a strong outdoor apparel brand in Germany and China that competes with Patagonia, North Face, Adidas and Nike. They sell jackets, footwear and outdoor equipment, such as packs and bags, travel bags, tents, sleeping bags and accessories. Outdoor apparel includes the likes of softshell jackets, fleece jackets, windbreakers and rain jackets In 2019 the segment did €319M in sales and €23M in EBITDA. This year Jack Wolfskin should have sales in the range of €330-€350M with mid single digit EBITDA margins (€20M). Management outlined on the recent investor day that by 2025 they can grow EBITDA to €70M and €475M in sales through growing DTC to 50%+ of the overall business.
TravisMathew and JackWolfskin drive the segment making up ~60% of segment sales. Rounding out the group there is the traditional Callaway soft goods business that sells golf apparel, footwear, golf bags, golf gloves and headwear. OGIO (acquired in 2017) offers storage gear like backpacks, travel bags, duffle bags, and golf bags. This brand is more targeted at athletes that play golf, skate, ski, snowboard, surf and BMX.
There is some cyclicality at the brand level (Callaway brand following the historic trends of the golf equipment business and Jack Wolfskin being a stronger contributor in the second half of the year), but they tend to balance each other out. When looking at the segment on the whole, management guided to 20%+ growth for the full year to $1B in sales in May. Apparel is a tough business with high single digit or low double digit operating margins. Through DTC expansion and lower cost structure this business could get to low double digit operating margins while growing at a mid teens clip to 2025.
Apparel segment model assumptions: 13% sales CAGR through 2027 and 160bps of operating margin expansion to 10%.
Golf Equipment
The Golf Equipment business is the legacy business everyone thinks about when they hear Callaway. It contributed $1.2B in revenue last year (39%) and $204M in segment operating profit (16.5% operating margin). Golf clubs are the largest revenue contributor at 80% of revenue and sales are up 30% over 2019 due to the COVID golf bump. The segment has grown 10.8% per year since 2016 and operating income has grown 23%.
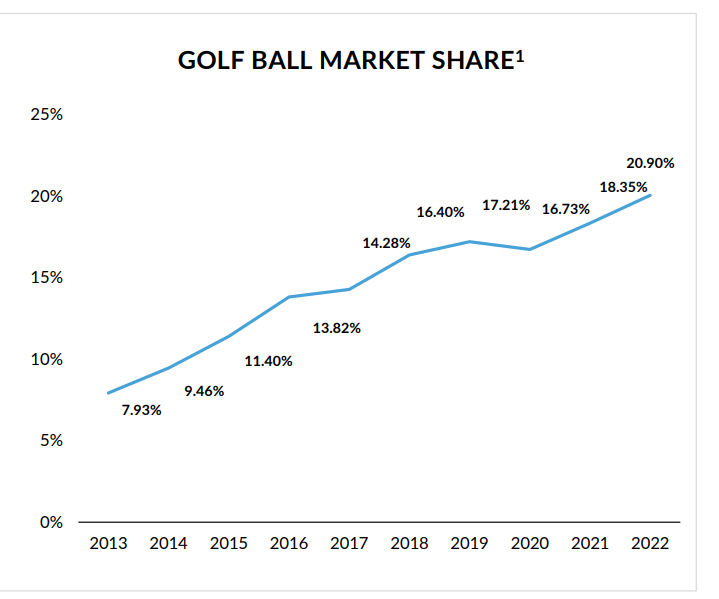
Callaway’s market share in golf balls, led by their popular brands Chrome Soft and Stratahas steadily grown from 7.9% of the market in 2013 to nearly 21% in 2022. Callaway is second in market share by dollar in golf balls behind Acushnet which owns Titleist and the Pro V1 line of golf balls which has a 50%+ market share. It would make sense for this market to continue to consolidate and fall into an oligopoly with a dominant #1 and #2 players with the rest of the field (think Bridgestone and others) making up a small portion of the market. Golf balls are a better business than clubs because they are higher margin, repeat purchases as golfers will lose balls over time or hit them for practice and do not retrieve them creating steady demand from avid players.
Callaway is the number one player in the golf clubs market with 25% market share. They have #1 or #2 market share in every major club category over the past 4 years from drivers to irons marketed under the Callaway brand and putters under the Odyssey brand.

Overall, the golf club assembly process is fairly labor intensive and requires extensive global supply chain coordination and has a variable cost structure (variable costs range between 85% to 95% for golf club products and 70% to 80% for golf ball products) which prohibits significant margin expansion making this a brutal business. In addition, the end markets are tough, slow growing, seasonal and somewhat impacted by weather. They compete with TaylorMade, Ping, Titleist (Scotty Cameron) and a host of others.
This business is a solid cash flow contributor, but is incredibly difficult. Management has done well to pair this with TopGolf using the cash generation to fund further investment in Topgolf and TopTracer. The golf ball business is growing faster than the club business because of shorter product lifetimes (clubs will last people a decade). There is limited room for reinvestment in this segment, but it has enabled management to acquire and diversify into other operations.
Revenue was up 24% year over year in Q1’22, but management expects it to be up only 10% for the full year, baking in significant back half slow down. After that the business should grow in line with the industry at low single digit 2-4% range with stable mid teens margins.
Golf Equipment model assumptions: 10% growth this year with a slowdown to industry level (3%) CAGR through 2025 and margins in line with 2910-2019 levels at 14%.
The Golf Industry
The golf industry is split into two categories: on-course golf which is growing at low single digits and best tracked through rounds played, Callaway has steadily eased its reliance on this portion and off-course golf which is dominated by TopGolf’s 85% share of the market. The off-course golf industry is growing much faster at a mid to high single digit clip. Today the total 37.5M golfer pool comprises 25.1M in on course only golfers, only 3.3% above 2019 with 12.4M in off course only golfers (up 25% against 2019). Off course growth has been tied to the expansion of TopGolf. As I mentioned earlier, increased Topgolf participation should translate to on course participation.
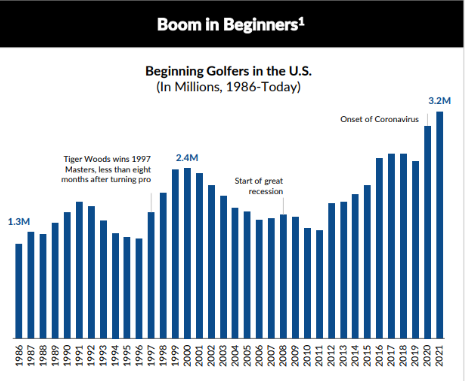
The legacy on course industry’s recent growth has been driven by a COVID bump as it was perhaps the single easiest “socially distance-able” sport. There are however, longer term sticky trends here at play. Suburbanization is driving demand as it is easier to golf in Florida than New York City, sustained hybrid work increases leisure time (35% of people say they have more leisure time now than prior to the pandemic), and a broader enthusiasm for the sport.
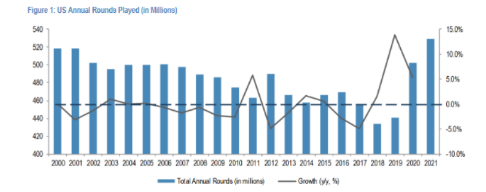
The last time the on-course industry experienced this large of interest and growth (as measured by annual rounds played) was around the time Tiger Woods made his debut on Tour in the late 90s. 2021 was the highest number of rounds ever played on record at 529M, up 6% year over year and has been flat through 2022. According to the National Golf Foundation’s annual report, the number of on-course golfers increased by approximately 300,000 in 2021 to 25.1 million players, marking the fourth straight year of increased participation in traditional golf (1.3% average annual growth)
Total golf participation (on and off course) has consistently grown since 2014, with 37.5M participants in 2021 representing a 25% increase over 2014’s 30.1M participants (3.2% CAGR)
Total participation grew at a 2.6% CAGR in the 5 year pre pandemic period and accelerated to a 4.7% CAGR over the pandemic. Off-course participation also continued to grow, with 24.8 million people visiting nontraditional venues such as Topgolf and 5-Iron and approximately half of those playing exclusively off course. This was driven by off course only participation up 25% over 2019 to 12.4mn. Since 2017 off course golf has grown at 10.5% per year while overall participation has grown only 4%.

There is also reason to believe in an expanded and healthier Golf TAM post COVID driven by increased participation led by off course with on course stable, a professional backdrop with the PGA Tour (Tigers Woods’ 2022 return alongside 2023 Netflix series, healthy distribution as Dick’s CEO Ed Stack stated “we’re very excited about the Golf business” in mid March, secular increased spending on experiences as opposed to “things,” and a sticky customer base due to high upfront investment and growth in avid golfer segment.
In a recession the industry is in a strong position with an affluent core customer with $100k+ household income with high resiliency making them less price sensitive and less likely to change habits significantly if the economy turns. The avid golfer is a more affluent and sticky customer who accounts for 70% of all US golf spending and the National Golf Foundation cites a stable base of 20M committed golfers accounting for 90% of rounds played and golf spend.
Callaway is particularly well positioned in the industry after its Topgolf acquisition.Topgolf acts a logical on-ramp for non-golfers (50% of customer base) to try the sport and creates a flywheel to nurture brand affiliation for those that are inclined to pursue golf on-course. 75% of non-golfers who visited Topgolf said they were now interested in playing on a course. By reducing exposure to the golf equipment business, Callaway no longer has to rely purely on the golf industry but can benefit from the eatertainment trend at large.
Therefore, in an inflationary and/or recessionary environment, the avid golfer may cut back on big-ticket purchases or other leisure activities before they cut back on rounds played and golf related spend. JPM notes in the ELY coverage initiation that there were “only minor declines in y/y rounds played around the GFC (averaged -2% decline per year 2008-2010.)”
Moat
With wait times north of 2 hours and 40% cash on cash returns, the key question is how sustainable is Topgolf and will high returns draw in new customers? Truthfully, the apparel and golf equipment lines may have some brand recognition, but the moat is weak at best. Topgolf on the other hand has a durable competitive advantage through its scale, brand awareness, long, complex and capital intensive builds.
As I mentioned, Topgolf venues cost $10M-$55M to build barring out mom and pop operators. There are no other large scale competitors that are building facilities like this. DriveShack, Topgolf’s closest competitor, opened four locations and announced they had two more in the pipeline, however they recently halted progress on one and the New York venue is being completed begrudgingly. DS pivoted away from the large footprint venues, toward the Puttery concept which resembles more of a mini golf experience.
As the author of the write up on VIC quotes, “I would not be shocked if they are never going to open another one. There’s nobody that can compete in the big box with Topgolf. Nobody can. Not from a technology standpoint. They own the market. They’re going to own the market. And anybody that comes in, in any reasonable way, you’re going to have to invest a couple of hundred million dollars, and it just doesn’t make sense to do that.” – Former TopGolf CEO
The size and scale and operational complexity of the development 12 month build times , acquiring permits etc) as well as the technology needed seems to box out one-off competition. Landlords won’t fund 75% of development costs in exchange for a 20+ year lease for a non-Topgolf concept because they question competitors’ durability.
Topgolf also enables a flywheel for the rest of the business. By on-ramping new interest in golf, Topgolf can act as a top of funnel to cross sell new golfers into Callaway equipment and apparel brands.
On the TopTracer side, they have collected data on nearly 2 billion balls hit. No other company has the scale or data Toptracer has. Toptracer also has an easier time getting sold into ranges because of the existing client relationships through Callaway. Trackman, Toptracer, closest competitor, is only in ~4,000 bays compared to Toptracer’s 15,000. The scale of TopTracer and capital intensity of Topgolf should protect future returns on capital.
Competitive Threats and Risks
There are a few bear cases that are worth unpacking for Callaway and TopGolf particularly (where I believe the majority of the value is). Topgolf could turn out to be a fad. My pushback here is that there has been a wider proliferation of eatertainment that is sticky with younger generations and Topgolf is the quintessential example of one. The complex nature should preclude potential competitors unless they have hundreds of millions of dollars to set on fire for half a decade to replicate Topgolf’s scale. I would also point to the fact that bowling alleys have persisted for decades and that Topgolf may be a modern day, large scale bowling alley which has proved to be a durable business with strong economics.
DS has recently pivoted away from the large scale venues and focused more heavily on the Puttery segment highlighting that these concepts have better economics. The obvious question that follows is “Well, if Topgolf is such a good business then why would DriveShack pivot and highlight better economics in the new concept?” To fully fund these venues without seeking financing from a landlord is really really difficult and brings down the returns on capital significantly. Landlords aren’t willing to fund anyone beside Topgolf in this arena, especially smaller players with only a few concepts, because they believe they will get competed away. Therefore, Topgolf’s access to financing and brand recognition further entrench their economics. As an aside, I think Puttery has lower barriers to entry because they are not as capital intensive and leaves them open to competitive risks.
Topgolf does compete for the overall pie of consumer leisure time and discretionary spend. So concepts like Punch Bowl Social, Dave & Buster’s, Pinstripes do pose a threat. I think carving out the big box golf niche protects them from competition here. It’s more convenient than minigolf because you can sit and eat in the same spot instead of walking around from hole to hole and different from any other concept.
Last note on Topgolf, as I dove into earlier, the average consumer has relatively high household net income and therefore high disposable income so inflationary impacts haven’t slown them down yet. Management recently stated that “are more than covering” inflation and cost pressure, “through a combination of sales leverage, operating efficiencies, and pricing.” Chip Brewer, CEO, also stated that they, “are not seeing any slowdown in consumer demand. I understand the angst, but at some point, we should look at the facts, and the facts are that we’re not seeing it on a global basis.”
TopTracer’s biggest competitor is Trackman which has 4,000 bays. Just noting the scale and management’s intent to add 8,000 TopTracers per year, they are adding about 2 Trackman’s per year through 2025.
The real pressure hanging on the stock right now is around the golf equipment business. It is still a large portion (39%) of revenues and the most significant contributor to EBIT. ELY is being punished as the golf equipment business is seen as a one time COVID winner and is due to suffer as we head into a recession. Management has made “modest use of price so far this year” and believe that there is an opportunity for additional price increase to offset costs further in the future. Their core consumer in this segment is also very resilient with high household net income. The truth is as the inflationary tide lifts all boats, these consumers are far enough out in the water that they see the drastic changes in the tide.
Margins may be impacted somewhat by inflation and supply chain disruptions as ELY has heavy exposure to Vietnam and China, but price taking should be able to offset that. There has also been pushback that Jack Wolfskinhas had issues in the past citing stagnant sales. With a brand rehaul underway and focus on DTC, even mid single digit topline growth would boost margins.
Management and Capital Allocation
Callaway’s CEO since 2012, Chip Brewer was previously on the Topgolf board before the merger and on the board of the National Golf Foundation from 2014-2019. He was COO of Adams Golf from August 2000 to January 2002. He played a prominent role in turning around Adam’s Golf and selling it to TaylorMade for $10 a share, when he took over the stock was at $2. He has recently been buying shares in the open market between $21-$25.
This team’s past history of capital allocation has been incredibly strong. They bought OGIO for $75M in 2017, TravisMathew, which has been a homerun, for $125M in the same year and Jack Wolfskin for $475M in 2019. The pandemic era deal for TopGolf for $2.6B has transformed this business and will comprise the majority of value going forward. Paying 12x 2022 EBITDA ($215M) for a long runway of venue count growth, 40% cash on cash returns, a top of funnel flywheel for the rest of their business and TopTracer was an incredible move.
CFO Brian Lynch has also been buying shares in March and December in the open market at around the same price as Mr. Brewer. He also has a track record of comfortably beating guidance. When the Topgolf deal was announced they guided to $360mm of 2022 EBITDA but are now on pace for $500mm.
Arthur Starrs has been the CEO of Topgolf since April 2021, he was previously global CEO of Pizza Hut from July 2019 and President of Pizza Hut U.S. from April 2016 to July 2019. He graduated from Princeton and started his career in IB.
As you can see below, the majority of free cash flow has been used on lumpy acquisitions. I left out the Topgolf merger from the chart below for clarity’s sake since every other year pales in comparison. Capex and R&D have made up 48% of total outlays. 5% of FCF has been used to buy back stock and pay dividends. Management has stopped paying dividends in order to reinvest in Topgolf’s new venues and any excess cash has been to buy back stock. Acquisitions have made up half of all outlays. Over the period, ELY’s cash from operations was equal to its R&D, returns to shareholders and CapEx.

Digging into acquisition ROIC, Topgolf and TarvisMathew were both acquired for ~12x normalized EBITDA or a 8.3% ROIC. This estimate is probably on the low side considering the growth rate and long duration of both businesses. I estimate that ELY has earned 40-50% on its capex and R&D spend over the last 5 years. Blending both internal spend (R&D+CapEx) and external spend (acquisitions) I estimate that ELY has earned ~17% returns on invested capital and deployed 100% of FCF over the last 5 years.
Future free cash flow will be used to pay down debt and maintain net leverage below 3x, reinvest back into Topgolf venues and TravisMathew at 40% cash on cash returns and 2 year payback periods, respectively and any excess cash will be used to buy back stock.
Valuation
Trading at ~11x 2022 EBITDA and ~10x 2023 EBITDA, post TopGolf acquisition and heightened interest in golf, Callaway can likely deliver mid-teens annual EBITDA for at least the next 3-5 years. Looking at comps, I primarily used casinos, other entertainment concepts, sporting goods stores and theme parks. On an EV/EBITDA and EV/EBIT basis, Callaway trades toward the lower range of their peer group:
- ELY: 11x EV/EBITDA, 20x EV/EBIT, $6.4bn EV
- GOLF: 12-14x FCF, 11.86 EV/EBITDA, 13.86x EV/EBIT
- SIX: 11x EV/EBITDA, 15x EV/EBIT, 18x P/FCF
- FUN: 20x P/FCF, 12x EV/EBITDA, 15x EV/EBITDA
- PLAY: 10x EV/EBITDA, 13x EV/EBIT
- BYD: 10x P/FCF, EV/EBIT 15x
- LVS: 15x P/FCF, 12x EV/EBITDA, 18x, EV/EBIT
- MGM: 13x P/FCF, 12x EV/EBITDA, 17x EV/EBIT
- BOWL: 15x EV/EBITDA
- DKS: 10x EV/EBIT, 6x EV/EBITDA, 10x P/FCF
As demonstrated, Callaway is no longer a legacy golf equipment business and deserves to trade at a premium multiple to GOLF and other peers. Topgolf, which will provide more than half of all EBITDA by 2025 and deserve a mid teens multiple due to its tremendous unit economics and long runway for growth.
By 2025, I believe ELY can generate $2.00 per share of FCF. Propelled by mid to high teens EBITDA margin in TopGolf High teens annual revenue growth and $280M in maintenance capex spend of ~200M shares. This base case scenario with a 5% FCF yield results in a $40 stock and a 22% IRR. This case has several levers of conservatism built in including: no new unit growth acceleration and low single digit SVS despite productivity initiatives such as bay utilization, mobile ordering and dynamic pricing.
Bear case is that golf is a fad and the golf business reverts to 2019 levels of $200M in EBITDA. Trading in line with GOLF at 11x implies a $2.2bn valuation. If TopGolf stops growing at the end of this year at $1.4B in revenue on a 15% EBITDA margin or $210M at 12x implies $2.5B of value. If apparel is valued at 10x 2021 EBITDA ($700M) downside to current EV is around 13%.
For the bull case, I note that ELY was guiding to $1B of EBITDA by the end of the decade and recently changed their tune to $800M in EBITDA by 2025. This number is still arguably conservative as Chip Brewer has stated, “We did feel comfortable that even if you had that pullback in golf equipment , you could hit $800mn in EBITDA by 2025.” Management has guided to $600M of cash from operations and $150M of maintenance capex. $450M of simple FCF on ~200M shares is $2.50 per share of FCF. Excluding growth capex is a reasonable way to value the business as it gives us more clarity into normalized FCF at maturity, growth capex is discretionary spend and as shareholders we should encourage the business to reinvest organically as Topgolf unit economics print 40% returns. At a 5% FCF yield ELY is a $50 stock in 3 years, a 30% IRR.
My ears perk up when I’m listening to a call and hear a comment like this, “I’ve never, in my 20-plus years now of running a public company, seen as big a fundamental difference between the performance of the company and the share price. So that’s this is new ground for me.”
Doing an expected value analysis of our bull ($2.50 in FCF at 22x multiple=$55), base ($40) and bear case ($1.50 in FCF* 13x multiple= $20) weighted 40%, 40% and 20% respectively. My expected value for ELY by 2025 is $42 per share or a 23.6% IRR.
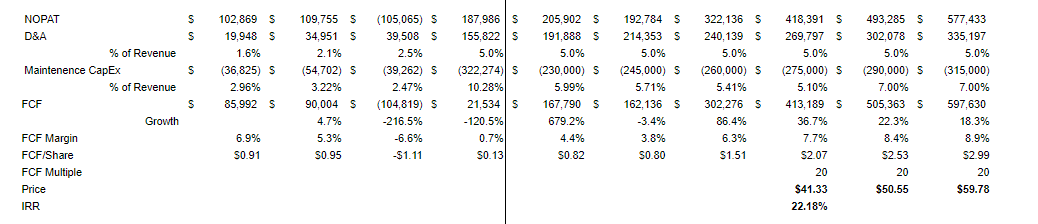
Base case model below:
Key assumptions: See segment models at the end of each segment discussion for more detail, 10% EBIT margin by 2025, yearly interest expense of $70M, after $136M this year, 21% tax rate, 200M shares out. 4% FCF yield at exit. This gives us a low to mid single FCF margin, excess FCF can be used to reinvest in Topgolf at faster rates.
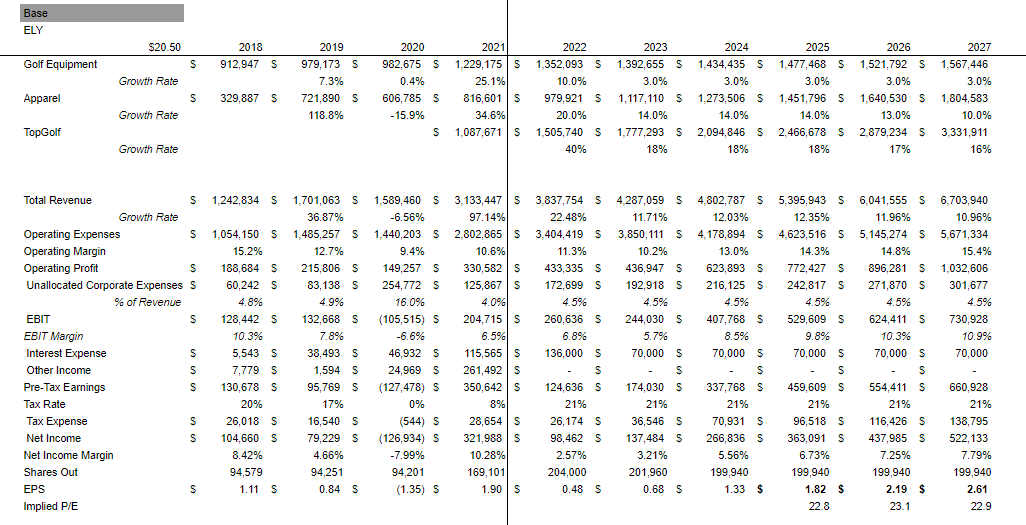
FCF Model: NOPAT=EBIT*(1-Tax Rate)
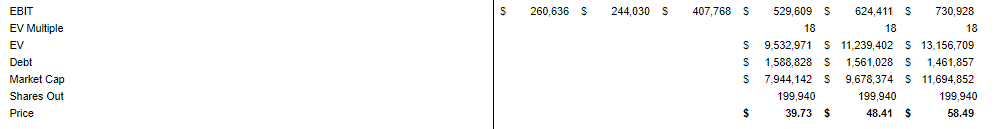
On an EV/EBIT Basis
Sources
Perfect Putt by Jared Doerfler
2022 Investor Day Presentation
March 2022 Investor Conference
Callaway-Topgolf November 2021 Presentation
10K and Earnings Calls