Author: Ben Tewey
Published: 4/27/22
Price at Publish: $325.25
Overview
Banking is a fun business: you get to meet people on one of the days they make a happy memory. Customers go to banks when they are generally buying a house, a car, or expanding their business– it’s exciting. This is especially true for regional banks in tight knit communities, people root for each other in these areas and helping others succeed is a good spot to be in life. Accepting deposits with one hand and loaning them out with another in an attempt of making a spread is a wonderfully simple business.
Hingham Institution for Savings (Ticker: HIFS) appreciates and focuses on this simplicity. Hingham Institution for Savings is a Massachusetts-chartered savings bank headquartered in Hingham, Massachusetts. The bank was originally chartered in 1834 making it one of the oldest banks in the United States.
HIFS is almost entirely focused on real-estate lending, with commercial real estate comprising 71% of the loan book. Management focuses on keeping origination and management of its loans simple. HIFS has increased its loan book from $850m in 2011 to $3.4bn as of Q1 ‘22 (12% CAGR) through organic growth, funded through retained earnings.
The bank does not rely on fee income (which is typically generated through service fees on deposit accounts). Hingham’s believes that these fees are eventually headed to zero and that longer term community banks will be unable to rely on fee income for a major part of their revenues. Despite tripling deposits since 2010, service fee income is down ~25% during the period.
As a percentage of total assets loans have grown from 75% in 2011 to 98.5% in 2022. Commercial and consumer loans make up a negligible amount of total loans. Within the loan portfolio residential loans make up 22% and commercial real estate 71%. This is a shift from 45% residential, 48% commercial, and 5% construction in 2011.
Through its six offices in Boston and eastern Massachusetts, and its commercial lenders and relationship managers in Washington, D.C the bank has a physical footprint largely in and around Hingham.
The bank’s primary business is commercial and residential real estate mortgage lending, funded by retail and commercial deposits, wholesale deposits and borrowings secured by properties in eastern Massachusetts. The Bank lends to commercial real estate borrowers and services deposits for customers in the greater Washington, D.C. metropolitan area and in the San Francisco Bay Area.
Large insider ownership (32% owned by the Gaughen Family) aligns management with shareholders and serves as a powerful risk mitigant. The management philosophy at HIFS today is one of extreme focus. Management is locked on to controlling the two factors banks can control: loan losses and overhead costs.
Since 1993, when present management took over, Hingham has been one of the lowest cost banks in the U.S. at approximately 0.55% of total assets to operate the bank and has compounded book value per share at 11.4% per year with an average ROE north of 14% since 2009. As of Q1 22, HIFS had $3.6bn of assets and generated $63mn of net income over the prior four quarters.
History
I don’t often analyze a company’s story or history in these write ups as often it isn’t too helpful. I tend to look at historic trends and tailwinds, however I feel for Hingham it is a constructive exercise when analyzing the banks futures prospects. As we will see, the culture is what sets HIFS far apart from competitors.
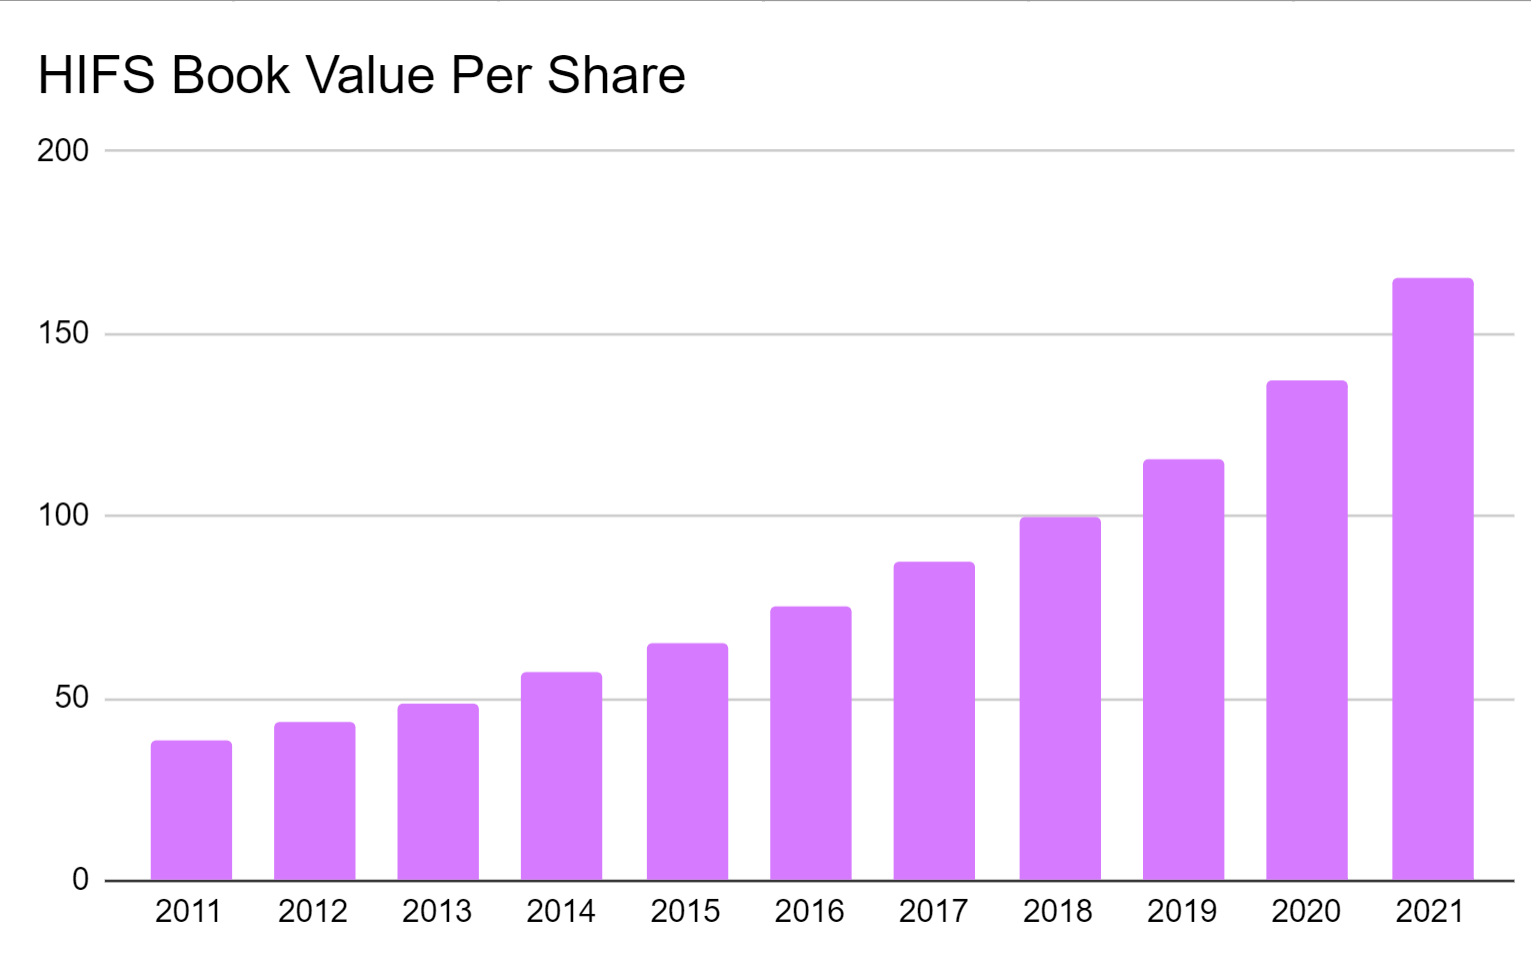
Over the next 26 years, the company’s loan quality improved, its branch network expanded outside of Hingham, Massachusetts, and Book Value per Share grew 14 times. The company’s share price has grown 15.6% per year (including dividends).
The history of HIFS dates back to 1834, making it one of America’s oldest banks originating its first loan, $400, in 1835. Originally the bank operated without a building accepting deposits at convenience store one day a week. At the time of its founding Hingham, Mass. was a town of 3,500 residents. Times have changed.
150 and years later, the bank went public, but quickly ran into problems. The FDIC filed a Memorandum of Understanding and Hingham lost $8 million between 1989 and 1991. Wilfred Creighton, the former president of the bank was found to have engaged in bank fraud and kickbacks. In 1993, a former Hingham president was arrested on charges that illegally approved loans cost the bank millions, in addition to the executive making $240,000.
In 1993, Robert H. Gaughen, the father of current chairman, Robert H. Gaughen, Jr., won a proxy battle alongside a group of shareholders for control of the bank.
Immediately, the Gaughen’s reduced loans to riskier lines of business such as speculative construction and restructured how the bank conducted personal loans. Gaughen repositioned the bank, focusing on higher quality commercial real-estate.
Robert Gaughen continued to hone in on the niche market near Boston’s South Shore that Hingham serviced. It took two from the time the Gaughen’s wrestled control to expand their footprint to towns nearby Hingham.
Hingham expanded to Nantucket in 2013, opening the bank a whopping 90 miles from the home town! This satellite branch allowed management to test their abilities to manage a branch with moderate distance in an attractive geography with high net work properties.
As we dive into later, Boston is a highly competitive market with approximately two dozen banks operating in that area. By most accounts, DC (the newest and furthest expansion) is a simpler town for Hingham to compete in. DC and Boston are similar in size, coastal cities with opportunities to reinvest.
Before leaving this section I want to quickly touch on the bank during the GFC. Many regional banks were hammered during the downturn, however HIFS, due to phenomenal management, escaped with barely a scrap. 2006 and 2007 are the only times in the Gaughen Era that the bank earned less than 10% return on equity and Hingham has been profitable every year since 1993. Fanatics.
Operations
A bank can be a very simple business. With one hand you accept deposits and offer interest on them and with the other you loan out money and a higher rate of interest and collect the spread. As Ben Franklin would say, “Things should be as simple as possible and no more simple.” The Gaughen’s fully embrace this notion. Management focuses on three things: Commercial Real Estate Lending, Commercial and Personal Deposit Banking and Residential Real Estate Lending. That’s it. They keep it as simple as possible. The beauty of it is this is phenomenal business, as long as they avoid the big mistakes.
Hingham has clearly defined the edge of their sphere of competence in their investor presentations as seen below.

Management knows that when they operate outside of their sphere of competence, or sit down at the poker table to play someone else’s game, they become the patsy. It seems that no one is better in the public markets at playing the game than the Gaughen’s.
The Left Hand: Deposits
Deposits have nearly tripled from $730mn in 2010 to $2,393mn at year end 2021 (9.4% CAGR). Growth has been driven through the bank’s Speciality Deposits Groups (SDG) and Retail Banking Group (RBG). SDG maintains the largest and most complex deposit relationships as well as the digital-first accounts focusing on SMID business relationships. RBG operates in Boston, South Shore and Nantucket offering a single point of contact for deposit and residential lending. Average interest rate on deposits has fallen significantly at the bank

Unlike many other regional banks, Hingham has made a point to not rely on fee income as management holds the view that, perhaps like interchange fees at the major card networks, these are headed to zero. Fee income is modest and has continuously declined both nominally and as a percentage of revenue. The fees are interchange and some overdraft and have accounted for less than 1% of revenue for the past decade.
HIFS is not unique among banks, large or small, in seeking out low cost funding given the current yield curve. Non-interest bearing deposits are 16% of deposits at Hingham and have CAGR’d 16.2% since 2014. If HIFS can lower their core funding costs then net interest margin in a more normal environment may see incremental improvement. High or low interest rates are not necessarily important for banks. They both pose challenges (low interest rates force banks to find cheap alternatives for sourcing funds and high interest rates create a hurdle to jump over for interest rates on loans). What is more important is the change in pace (faster means it’s more difficult for the bank to keep up in either direction) and the absolute spread between rates.
The Bank also derives a portion of funds from borrowings from the FHLB, amortization and prepayment of loans and mortgage-backed securities, and sales of loans and securities.
The Right Hand: Loans
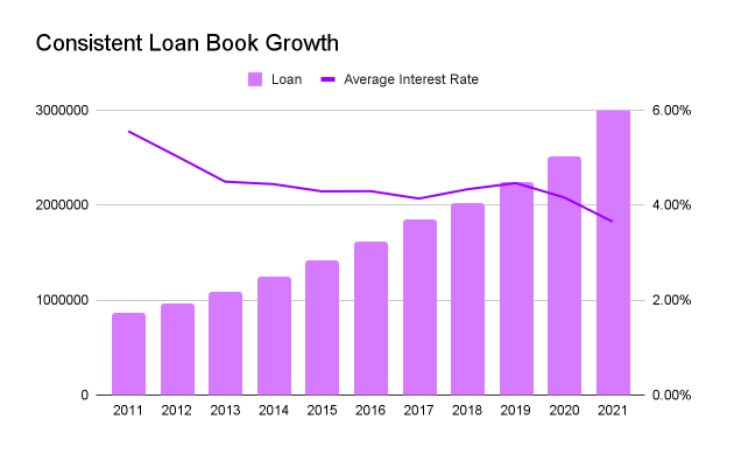
The exciting part at most banks, and this is certainly applicable to Hingham, is the loan book. HIFS has increased its net loan book from $850m in 2011 to $3bn in 2021 (12% CAGR) through retained earnings. Loans as a percentage of total assets have risen from 78% to 87.4%. Commercial and consumer loans make up a rounding error amount of total loans at 0.1%. Residential Real Estate (owner-occupied) loans make up 17.8%, Commercial Real Estate 76.1%, Construction Loans (owner-occupied and speculative) 5.2% and Home Equity (lines of credit and second mortgage loans, generally collateralized by second liens) 0.8%. A decade ago, the Residential RE and Commercial RE made up an equal portion of the portfolio. But since then, HIFS has moved more toward Commercial Real Estate loans because of their higher interest rate and better credit.


Residential Real Estate loans were $562.8mn in 2021, but has been shrinking as a percentage of the loan book since 2017 from 37.4% ($689mn) to 17.8%. The average interest rate earned on these loans This is partly due to the lower interest compared to Commercial lines and the fact that the bank only originates these loans in Massachusetts. Management is prudent about originating loans in this space and does not originate loans with a loan-to-value ratio greater than 80% without private mortgage insurance. All loans in this segment are collateralized by residential real estate that is owner-occupied at the time of origination
Commercial Real Estate is the majority of the loan book totaling $2.3 billion and secured by income-producing properties throughout Massachusetts (76% of the segment), DC (22%) and San Francisco (1%). They have grown 20% per year since 2016 and have gone from 40% of the loan book to 76%. These loans are for the refinancing, acquisition, or renovation of existing commercial real estate properties such as apartments, offices, industrial complexes, small retail properties or land. The average interest rate earned on real estate loans (both residential and commercial) was 4.11% in 2021, the highest yielding segment.
Below is a table of the Commercial Real Estate loans by collateral. Multifamily, residential, and office make up the majority of the segment.

Construction loans outstanding were $155.7mn are generally riskier due to the potential for the unexpected increases to costs on projects that tend to happen in every construction project known to man. In addition to that, payments can sometimes hinge on the sale of the property. As a result, these loans are only done in Mass.
The two smallest lines that are frankly negligible to the portfolio are Commercial, made to businesses and secured by assets of the business, and Consumer and are generally unsecured.
Underwriting Prudence
Hingham’s culture shines through in their underwriting. Both in process and track record, HIFS is an anomaly. All loans are reviewed and approved by Hingham’s executive committee and any loan greater than $2 million is reviewed by the bank’s full Board of Directors. This, although highly unusual, focuses risk management at the board level.
Secondly, HIFS holds all of the loans it originates. Management does not lay off loan risk to another bank and does not take part in roundtable loans with multiple parties. This allows them to assume full responsibility and gives them the ability to modify a loan when prudent.
Management has done well aligning incentives and putting their hand in the fire. And this has paid off for Hingham. The bank has an impressive history of almost zero loan losses which speaks to underwriting discipline.
Loan losses over the past eleven years have totaled $722k…total. The worst year for charge-offs was 2011 with 0.06% of the loan book. Although there is no slide for 2021, the company has disclosed an impressive chart comparing their total loan losses as a % of average loans to the average FDIC bank.
The allowance for loan losses is charged to earnings as losses that are estimated to have occurred. Loan losses are recognized against the allowance when management believes a loan is uncollectible. If you have studied insurance companies, you will recognize that this is an inherently subjective account as it requires estimates that are susceptible to significant revision as more information becomes available. These reserves are important, but subjective. Nothing tells a more unbiased story of underwriting acumen than the actual right-offs. Loan book quality is the most important metric to watch.

Management uses a seven tier internal rating system for their loans. Loans that are rated 1-3B are considered the lowest risk by the board. Well over 97% of all loans fall into this category
Net Interest Margin and Income
Net interest income is the most significant contribution to revenue and produced $102.5 million in revenue in 2021. It is also important to track the interest rate spread or the interest rate received on loans or securities minus the interest rate paid on deposits or other liabilities. Hingham has compounded net interest income at 10.4% per year since 2012. This is a result of maintaining a NIM above 3%, with the exception of 2018 and 2019 which were 2.90% and 2.72% respectively.

One of the most important metrics to track at a bank is the net interest margin, or the net interest income divided by the average total interest earning assets. Usual spreads for regional banks are 2.5-2.75% range. Hingham has been consistently above this mark. It’s important to note that Hingham has done this without exposure to riskier lines of business such as credit card or auto lending. Average total interest earnings assets have grown 10% per year since 2012 to $2.9bn in 2021.
Investment Portfolio
One of the many things that separated Buffett from other insurers in the mid 1960s was that the fortress balance sheet at NICO allowed him to invest in equities. This allowed Buffett to utilize the float of the insurance operation to earn high returns on equity. The same rings true at Hingham.
As with other things at HIFS, the investment portfolio is unique. Unlike just about every other bank, HIFS views its investment portfolio not as a source of liquidity to be maintained at an arbitrary percentage of total assets. Instead, the portfolio is viewed as a partial ownership of businesses over a long term time horizon. Beginning in 2014 Hingham shifted toward equities and away from fixed income and has built a $79.2mn common stock portfolio or about 22% book value. This is one of the highest ratios of any publicly-traded bank that I am aware of in the U.S.. Investments are focused on finance: banks, insurers, payment companies, financial infrastructure providers, and ratings agencies. While the exact holdings of the portfolio are unknown, management has indicated a few positions and given criteria for investment. Visa, Mastercard and Moody’s are in the portfolio. Favorites of ours here and they are focused on identifying businesses with strong returns on capital, owner-oriented management teams, good reinvestment opportunities or capital discipline, and reasonable valuations.
Hingham has also made a private investment in Founders Bank, a de novo bank organization in Washington, D.C of $1.0mn. that opened in April 2020.
Management said in the 10K that “The performance of these holdings should be evaluated on the basis of their contribution to growth in book value per share over time, not via quarterly adjustments to net income.” The investments should be judged on their impact to long term book value per share growth.
Moat
“Our experience has been that the manager of an already high- cost operation frequently is uncommonly resourceful in finding new ways to add to overhead, while the manager of a tightly-run operation usually continues to find additional methods to curtail costs, even when his costs are already well below those of his competitors.”- Warren Buffett, Berkshire Letter to Shareholders, 1978
Money is the ultimate fungible commodity and thus HIFS competes in a brutal industry. Anyone could start a bank in their markets tomorrow, although there would be some barriers they are not insurmountable. Large national banks with dense branch networks can have economies of scale and lower their cost of funds, but with a footprint of 8 locations HIFS is not exactly dense. The business’s competitive advantage stems from their relentless pursuit of a low cost operating model and the bank’s culture.
Throughout their expansions and various branch closure, HIFS’s Net Charge Offs, as we highlighted earlier, has been a rounding error at less than 0.05% of total assets compared to the industry average of greater than 2%.
Their Efficiency Ratio, a measure of the total operating expenses, divided by net interest income plus total other income, excluding gain on equity securities and gain on disposal of fixed assets, reached an all-time low at 21.31% in 2021. This makes Hingham one of the most efficient banks in the country. The average regional bank has an efficiency ratio between 55%-60%. Hingham’s is 67% lower than that! HIFS has remained well within their circle of competence as the bank has grown, religiously following and defining what they do and more importantly, what they don’t. Robert Gaughen said in the 2014 annual report, “Balance sheet growth at Hingham must be safe and it must be profitable, in that order.”

The key to the company’s success has been its culture. Patrick Gaughen, current President and COO of HIFS, wrote, “We are focused on finding exceptional people and creating the conditions for them to do what they enjoy doing, well. It means maintaining stable strategic priorities which in turn provides cultural stability – i.e. we focus on our customers and finding ways to improve the business, rather than on internal politics, or the new business priority du jour, or disruptive M&A, all of which are problematic and distracting for excellent people. Our ownership structure and the family involvement really helps on this point.”
Total operating expenses as a percentage of average total assets were 0.74% in 2021, or $22.1 million meaning it cost the bank just 0.74 bps to run itself.
As the Gaughen’s have acknowledged, there is a natural tension between the hingham cultural frugality and speed to expand. Management has shifted toward speed recently, the San Francisco and Washington offices are evidence of this, but they understand that operational leverage is what drives efficiency.
Looking at the business profitability, again HIFS rises to the top. Rolling five years ROE 17.22% which is an average of 8 points above HIFS’s peers. ROE is an important metric to measure for banks because it shows the success and productivity of the management at earning a return. Consistent double-digit ROE is rare in the banking industry, as we see with peers below compared, and HIFS has a long track record of exceeding 15%.

As the company stated on their 2016 Annual Meeting slides, “If Hingham ran its operations like the average Massachusetts bank, we would have spent an extra $29 million dollars on overhead in 2015,” which would have been half of net interest income.
The Hingham model is especially sound as a result of an efficient operating model, above-average loan origination ability, and coastal locations with secular growth trends in both population and income.
Management, Capital Allocation and Creating Value
As we touched on, management’s philosophy at Hingham is centered around extreme focus. Lending activities are practically exclusively in real estate, they only operate in 3 geographies, costs have continued to be cut to the bone and losses on loans have been negligible. The culture of focus shines through even in the ownership structure. Insiders own 32% of the company putting shareholders and management in the same boat. HIFS management eats their own cooking.
HIFS has a notably low dividend payout ratio for a bank at less than 10%. Retained earnings at the bank have been used to reinvest in organic growth, reinvest in the common stock portfolio and fortify the balance sheet with $360mn of cash and securities at year end 2021.
The primary non interest expense in banking is actually paying the people to be there to run the bank. They paid $14mn in salary and benefits in 2021 (14% of net interest income). Other operating expenses summing to $8mn.
Marketing expense, deposit insurance and occupancy expense have all been flat over the last decade highlighting the cost efficiency of the bank.
The two metrics that allow us to track the effectiveness of management are the growth in long term book value per share and the average return on assets. Book value per share has compounded at 14.1% since 2011 and average return on assets has been 1.5% over the last 5 years (a definitely tough stretch because of the low rates).
Management clearly defines capital allocation policy within the bank. They will first and foremost reinvest to drive organic growth in loans and deposits. They will then make private and public minority investments (they believe that control investments come at high prices, a loss of focus and cost synergies that never prove fruitful), they will then payout regular and special dividends. There are challenges to repurchasing shares because HIFS does not have a bank holding structure.
Competition
The banking industry is ultimately a commodity and HIFS must therefore compete on “price” (interest rate on deposits) and cost efficiency. Like insurance, banks will always face pressure to match their dumbest competitor on interest rate.
HIFS competes with the usual suspects in their home region around Boston. Bank of America and JP Morgan are the national banks in the region that benefit from scale economies and a strong brand recognition. The regional players include Eastern Bank, Rockland Trust, Boston Private, Cambridge Trust and a slew of smaller branches.
Although we have seen Hingham move outside of its bread and butter Massachusetts area, San Francisco and Washington are not all too different in terms of size and demographics. These similarities allow HIFS to structurally understand the market, hit the ground running and have a line of sight to double its asset size without ruffling too many feathers.
Looking Forward and Recent Expansion
Because HIFS generates sustainably high ROE and retains a large portion of their earnings, they can grow amazingly quick without stretching their balance sheet. The most recent and obvious expansions have been to Washington and San Francisco, while taking on larger loans.
Management has stated its desire to expand organically and to avoid acquisitions. They cite a loss of focus and ever elusive synergies as their reasons for steering clear.
The bank’s physical footprint has changed modestly over the last 5 years. In 2020, Hingham sold its branch in Scituate and closed its South Weymouth location. They then used a 1031 exchange to move into the Georgetown branch in DC and recently opened a branch in San Francisco.
The decision behind going to DC was made through two vectors. First, the region has favorable economic characteristics that will support long-term investments in commercial real estate. It is the capital of the world’s largest economy, has the highest household median income of any of the nation’s major metropolitan areas, and it has a relatively high concentration of young people. Second, the commercial real estate is similar to that of Boston with high density and restrictions on vertical development.
Hingham has prepared to originate residential owner-occupant loans in DC, but has not done closed one yet. The bank also built the capability to originate CRE loans in the Bay Area and has started to engage with customers after closing its first loan in the fourth quarter of 2021.
HIngham has stated that the most attractive markets for its business are “coastal, urban, gateway cities with substantial wealth, favorable demographics, substantial multifamily real estate, and consolidation among small and mid-sized banks.”
Hingham has been investing in mobile banking over the last few years. Mobile has three primary advantages 1) address more customers as both Hingham and the customers become less geographically constrained whether that be when customers move or simple ease of use as there are less visits to a branch 2) lower cost as Hingham has to pay less people to operate a branch and need less branches which brings down fixed costs and 3) mobile banking is highly scalable with low variable costs.
Yet another example of a manager of a tightly-run operation continuing to find additional ways to cut costs.
Valuation
Hingham’s current book value per share is $170.49 as of March 31, 2022. The bank’s current market cap of $730.6mn means shares are trading at $341 or 2x book. This is in-line with its five year average. Absent any euphoric run in regional banks it seems multiple expansion is a tough ask in the valuation story. 2x seems to be a justifiably fair multiple for a bank earning 1.5% on average assets excluding gain on securities and reinvesting 90% of their earnings at 15%. By this math, Hingham has compounded intrinsic value by 13.5% over the last 5 years.
With current shareholder’s equity of $365.3mn and a durable 15% ROE we get $54.8mn of net income. 10x earnings brings us to a valuation of $548mn. This implies a 1.5x book estimate or $255 per share. 1.75x book would be $298 per share.
Buying the bank at 1.5x book, assuming a 10% growth in book value per share and an exit multiple of 1.75x book we would receive a 12% IRR with dividends. From current prices we back into a 9% IRR in our P/E and BVPS models detailed below.
As we profile more and more idiosyncratic businesses, it becomes increasingly evident that they are difficult to value on a relative basis to peers. It is too simplistic to put in HIFS into a bucket with the rest of the Massachusetts banks or banks of similar size. No one has the culture to compete. Hingham’s ability to operate an equity portfolio, their operational efficiency relative and focused quality lending practices means that a relative valuation will significantly understate their intrinsic value. HIngham is also unlikely to be acquired or merged with another bank so there seems to be little use in valuing the business on a controlling multiple.
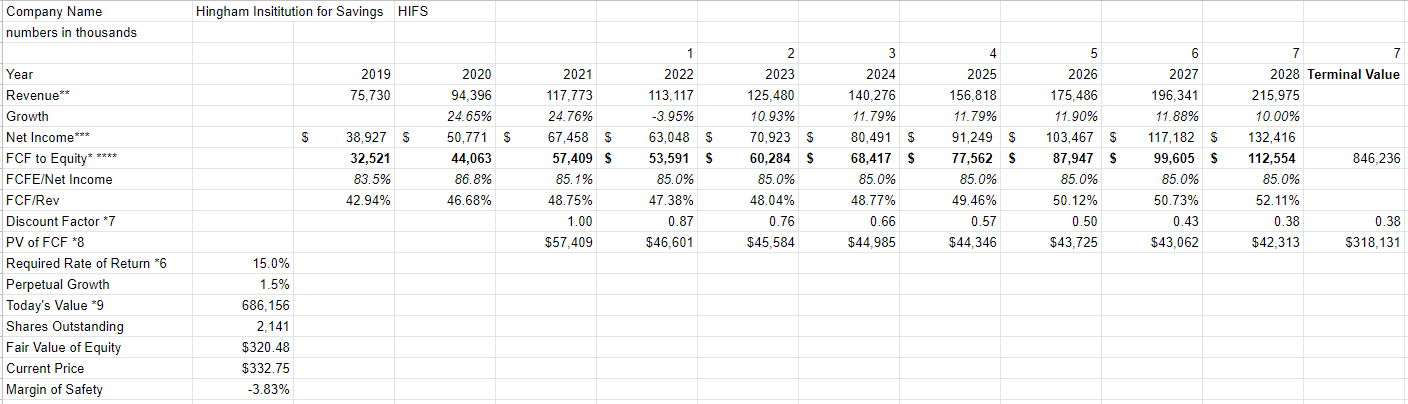
We offer two models below a discounted cash flow and a model incorporating growth book value per share (with assumption about growth in assets, liabilities and interest spread) capitalized at an exit multiple.
The model you see below is a hybrid of an income statement and balance sheet (these statements are intertwined as banks generate their income from assets and liabilities they hold on their balance sheet). The total assets and total liabilities will not sum to the reported numbers on the balance sheet as I do not take into account PP&E, A/R, deferred income taxes, foreclosure, A/P or escrow accounts. These are minor, non-interest bearing assets and liabilities that only appear from time to time in negligible amounts on the financial statements.


This is the model we used in constructing our DCF and BVPS valuation models. The assets number (refer to 1st image) is likely to be conservative as we have excluded the items discussed above which in turn make our estimation of future book value per share conservative. I attempted to recreate and model out the table found on page 23 of Hingham’s annual report.
Applying these assumptions using a multiple-based valuation approach below we reach an IRR of 9.13% through 2027 from current levels. If we were to purchase at 1.5x today’s book value ($255 per share) our IRR would rise to 14%. Price matters, no matter how good the business is.
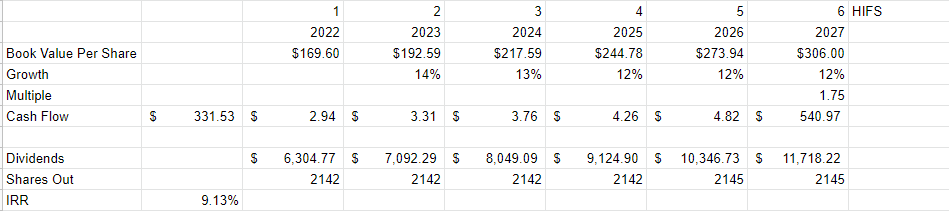
The same holds true for our P/E based valuation. See below.

Most banks cannot be valued on a DCF basis, but with their high percentage of retained earnings, HIFS seems as good a candidate as any.
DCF Assumptions
- We assume a 90% reinvestment rate for the next 5 years
- and is estimated to be 20% in the horizon period. The 20% reinvestment rate in the horizon period is based on a LT growth rate of 3% and a projected long-run ROE of 14.3%, assuming roughly unchanged yield/rates and asset/liability construction. I’m trying to be conservative here.
- HIFS will lean more on interest bearing deposits (as opposed to the higher interest rate FHLB debt).
- HIFS long-run tax rate will be approximately 27.5%
- A discount rate of 15%. My personal hurdle rate and about a 5 year double.
- I assume a long-run rate of return on equities of 10% (market return over decadal time horizons) and that the equity portfolio rises to 16.5% of shareholder’s equity.
- ROA creeps up by 11bps per year and ROE floats around 17-18%
- Loan growth is 11.5%
- Deposits growth is 8%
- Interest rate spread rises to the mid 3% range.
In my opinion, HIFS is built to generate 15% ROEs. Of course, this is dependent upon the yield curve (the steeper the better), but Hingham is capable of making the best of even the most challenging bank environments based on their culture and long term perspective. Even in challenging environments Hingham has been able to maintain a low teens ROE.
At 2x book, IRR is unlikely to get a boost from further multiple expansion. The market is a smart place and fully appreciates Hingham’s long-term shareholder orientation and management’s ability. We believe a 1.5x book provides a dependable margin of safety and potential for low to mid teens IRRs. Our book value and earnings multiple method yield us IRRs in the low teens from 1.5x book and DCF yield us a 14% return.
With that said, as long as Hingham continues to remain focused on the long term, retains a large majority of their earnings and reinvests them at high returns the bank will continue to compound shareholder value. For long-term investors looking for a partnership, HIFS is one of the best options available
Risks
Although HIFS is a conservatively run family bank with a long history of value creation, there are certainly risks still present. CRE lending is cyclical; the underlying cash flows generated by the properties could be hurt by an economic downturn which would increase vacancy rates. Like nearly all financial institutions a flat or persistently negatively sloped yield curve would hurt net interest income.
The bank has stated that they run interest rate models and that net interest income would decrease 5% if rates rise 100 basis points and would decrease 10% if rates rise 200 basis points.
Narrative follows prices. If the Gaughen family can continue to create value in the public markets, the board structure should not become an issue. However, if this stalls it would be difficult for an independent member to object to any strategy current management intends to try. One board member is the daughter of the CEO and does not have industry experience.
The key challenges highlighted by the management looking forward are: disciplined growth in new and existing markets (not overextending themselves or getting out ahead of their skis to write new business when the price is not right) and scaling the SDG to continue to reign in low cost funds and fuel growth. Below is a chart of new origination by geography in 2021

Conclusion
If I had to describe Hingham Institution for Savings in one word it would be idiosyncratic. This bank is like none-other. Family run, with incredible focus on being a low-cost operation, long term mindset both in underwriting prudence and management of the stock portfolio. This is the ideal team to partner with for the long term with a strong track record of superior capital allocation, the Hingham culture is truly idiosyncratic. The key metrics to track over time are the net interest margin (or interest rate spread), growth in deposits and loans, ROE, ROA, efficiency ratio and write-offs.
Bibliography
Investing Watchlist March 2021 Issue
Appendix
- The Bank, as a member of the Federal Home Loan Bank system, is required to maintain an investment in the capital stock of the Federal Home Loan Bank of Boston (“FHLB”). Based on redemption provisions of the FHLB, the stock has no quoted market value and is carried at cost. At its discretion, the FHLB may declare dividends on the stock. The Bank reviews for impairment based on the ultimate recoverability of the cost basis in the FHLB stock.
- Bank-owned life insurance (BOLI) policies are reflected on the Consolidated Balance Sheets at cash surrender value. Changes in cash surrender value, as well as insurance proceeds received in excess of the cash surrender value, are reflected in other income in the Consolidated Statements of Net Income and are not subject to income taxes.
- Although these financial results were strong, we can never lose sight of the fact that results in any given year do not fully describe the real accomplishments and progress at Hingham. Our long-term objective is to generate superior returns on equity capital through a disciplined strategy combining a commercial real estate lending business with a relationship-focused deposit business serving families, nonprofits, real estate investors, and institutions. We build these businesses slowly – one employee at a time, one relationship at a time, one loan at a time. There are no shortcuts.
- In calculating core net income, the Bank has not traditionally made any adjustments other than those relating to after-tax gains and losses on equity securities, both realized and unrealized. However, net income in 2021 included a $2.3 million pre-tax gain on the sale of the Bank’s former branch properties located in Weymouth and South Hingham. This compares to a $218,000 pre-tax gain recorded in 2020, related to the sale of the Bank’s former branch property in Scituate. Given the significant gains on disposal of fixed assets recorded in the current year, the Bank has excluded these gains from the calculation of core net income


Disclaimer: I am not a financial advisor. These articles are for educational purposes only. Investing of any kind involves risk. Your investments are solely your responsibility and we do not provide personalized investment advice. It is crucial that you conduct your own research. I am merely sharing my opinion with no guarantee of gains or losses on investments. Please consult your financial or tax professional prior to making an investment.